Free Access
Fig. 7
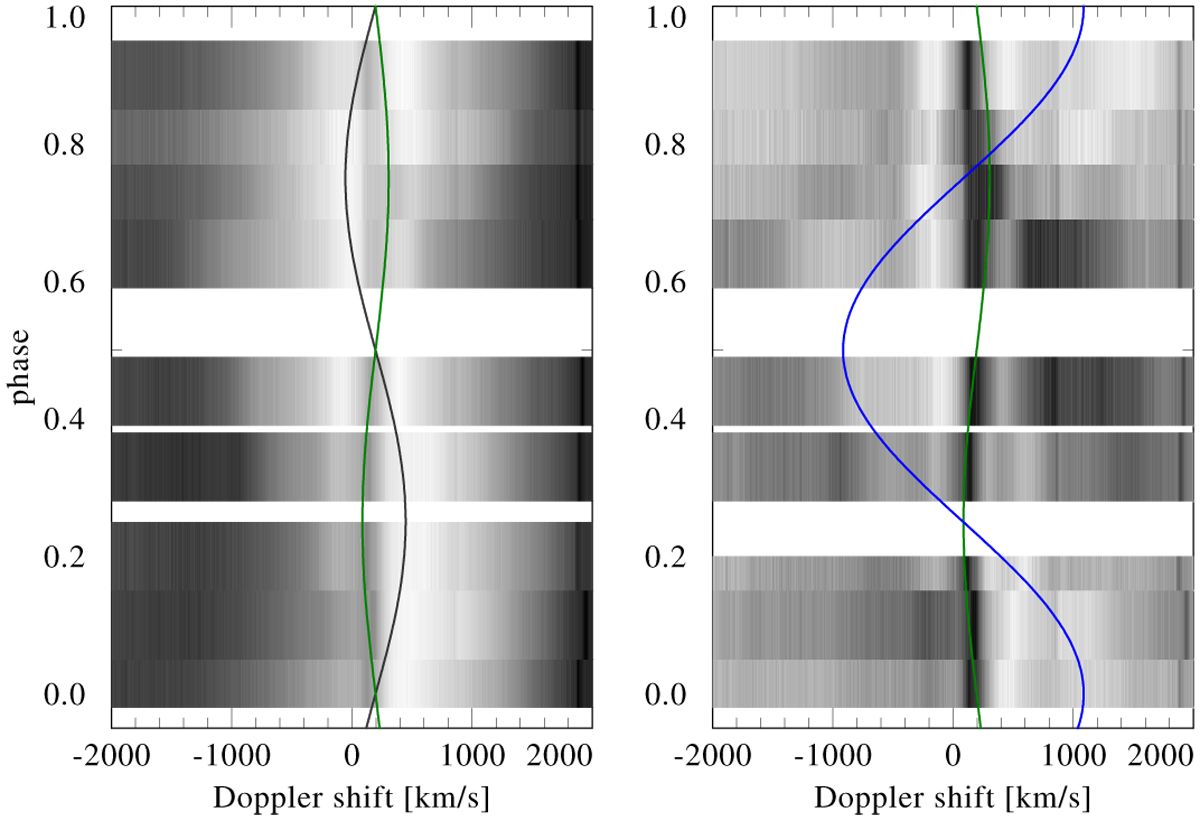
Left panel: dynamical spectrum of the He IIλ4686 line in velocity space. The RV curves of stars A and B are shown. Right panel: same as left panel, but with the contributionof the WR star subtracted. The residual emission excess (traced with the blue curve) follows the expected behavior of a WWC cone.
Current usage metrics show cumulative count of Article Views (full-text article views including HTML views, PDF and ePub downloads, according to the available data) and Abstracts Views on Vision4Press platform.
Data correspond to usage on the plateform after 2015. The current usage metrics is available 48-96 hours after online publication and is updated daily on week days.
Initial download of the metrics may take a while.