Fig. 13
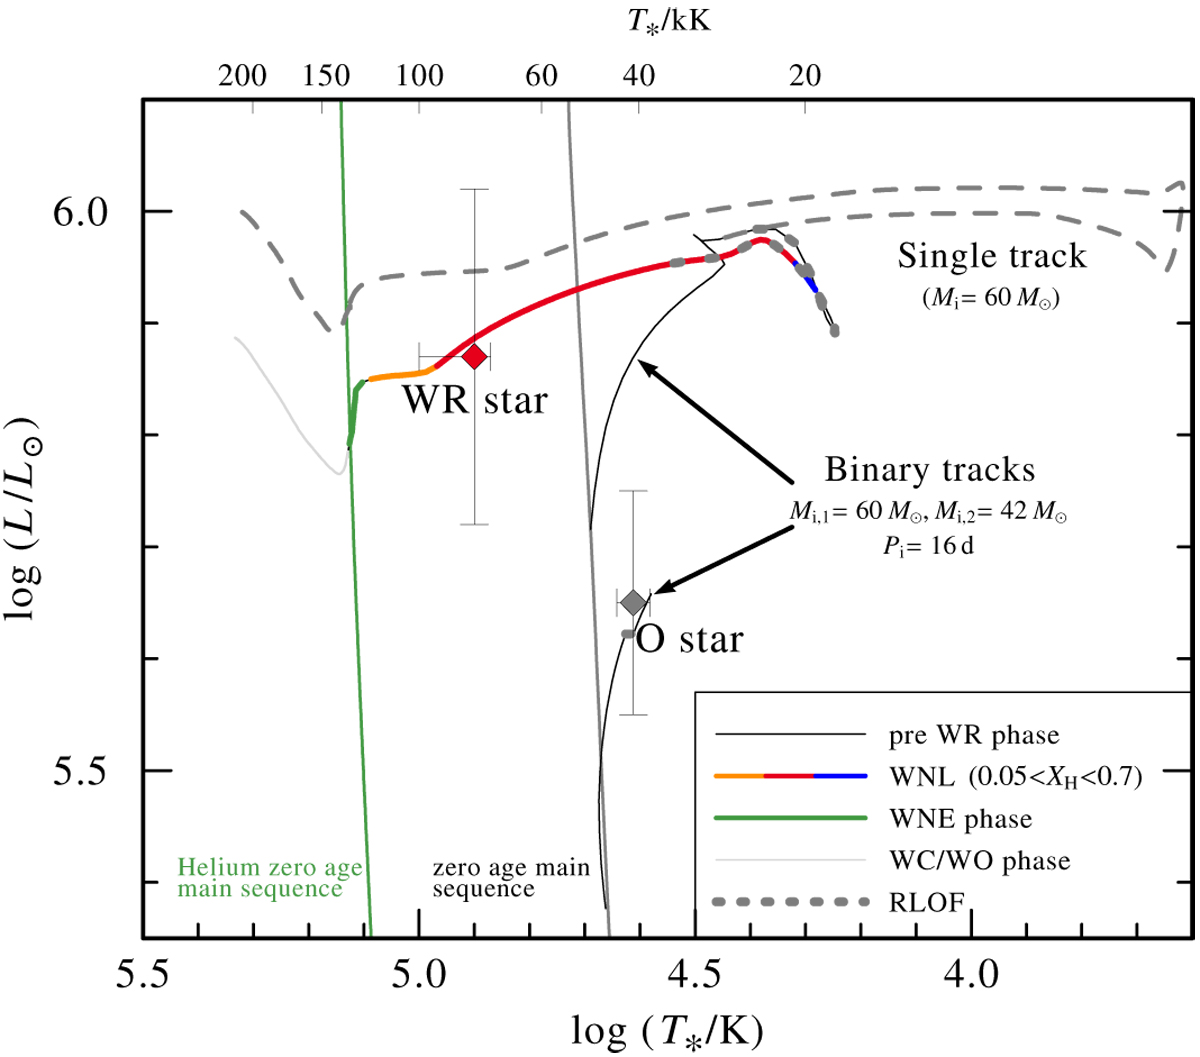
Best-fitting BPASS binary track for AB 6, calculated for Mi = 60 M⊙, qi = 0.7, and Pi = 16 d. The upper multi-colored track depicts the evolution of the WR primary until its core-collapse. The colors refer to surface hydrogen mass fractions of 0.45 < XH < 0.7 (blue), 0.2 < XH < 0.45 (red), 0.05 < XH < 0.2 (orange), and XH < 0.05 (green). The WC and RLOF phases are also marked. A track for a single 60 M⊙ star is shown for comparison (dashed gray line). The lower track depicts the evolution track of the O-type companion until the core collapse of the primary.
Current usage metrics show cumulative count of Article Views (full-text article views including HTML views, PDF and ePub downloads, according to the available data) and Abstracts Views on Vision4Press platform.
Data correspond to usage on the plateform after 2015. The current usage metrics is available 48-96 hours after online publication and is updated daily on week days.
Initial download of the metrics may take a while.