Fig. 8.
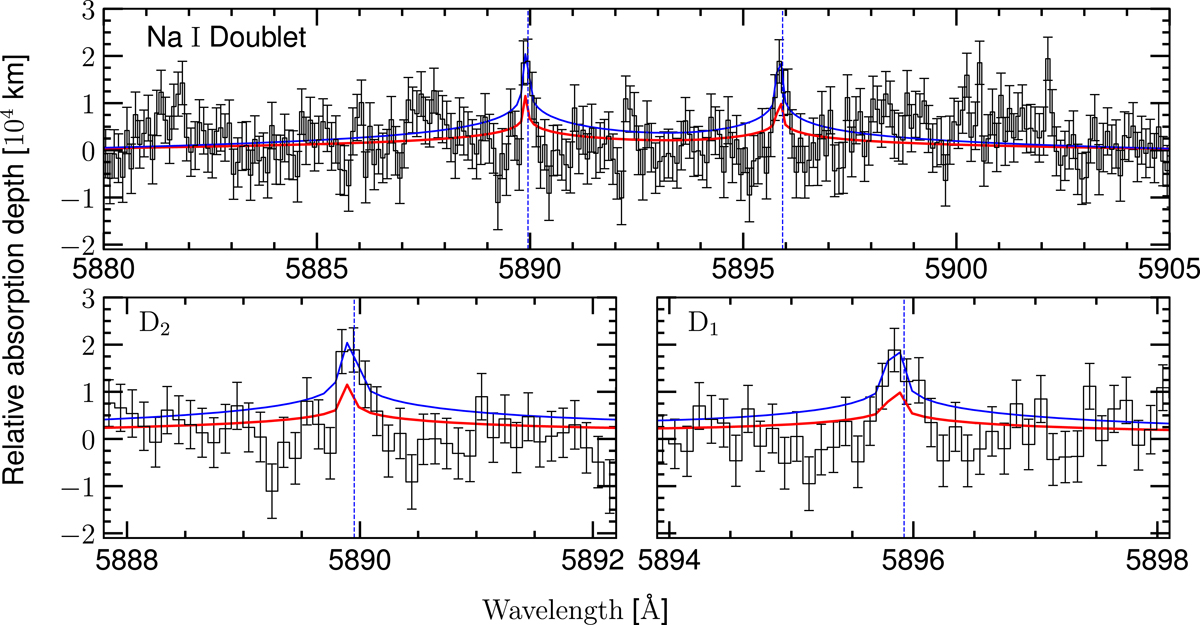
Fit of isothermal models to the transmission spectrum of MASCARA-2b in the Na I region. The vertical scale is atmospheric altitude in [km] assuming a planet-to-star radius ratio of ![]() . In red we show a model at the equilibrium temperature (Teq = 2260 K), which is adjusted to the continuum. One other model is adjusted to the lines core of each line using the data encompassed for a 0.3 Å bandwidth centered on the lines peak (shown in blue). For the D2 line the best-fit model is at T = 4240 ± 200 K and for the D1 line is at T = 4180 ± 310 K, i.e., the same temperature taking into account the uncertainties. In the top panel we show both Na I lines and the continuum surrounding. In the bottom panels we show each D2 (left) and D1 (right) lines zoomed. Data and models are presented binned by 10 pixels.
. In red we show a model at the equilibrium temperature (Teq = 2260 K), which is adjusted to the continuum. One other model is adjusted to the lines core of each line using the data encompassed for a 0.3 Å bandwidth centered on the lines peak (shown in blue). For the D2 line the best-fit model is at T = 4240 ± 200 K and for the D1 line is at T = 4180 ± 310 K, i.e., the same temperature taking into account the uncertainties. In the top panel we show both Na I lines and the continuum surrounding. In the bottom panels we show each D2 (left) and D1 (right) lines zoomed. Data and models are presented binned by 10 pixels.
Current usage metrics show cumulative count of Article Views (full-text article views including HTML views, PDF and ePub downloads, according to the available data) and Abstracts Views on Vision4Press platform.
Data correspond to usage on the plateform after 2015. The current usage metrics is available 48-96 hours after online publication and is updated daily on week days.
Initial download of the metrics may take a while.