Fig. 4.
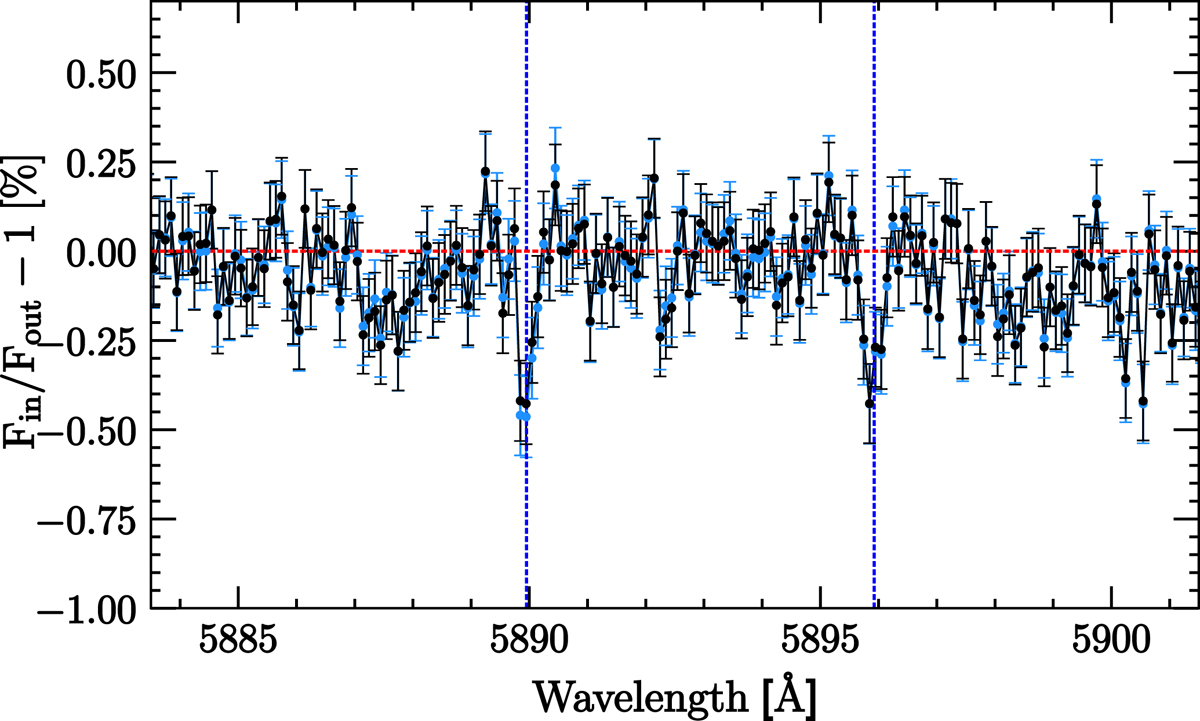
Comparison between the transmission spectra obtained with (light blue line) and without (black line) stellar RV correction, before correcting for the final RM and CLV effects. In both cases the spectrum is binned by 10 pixels. The blue vertical lines show the expected wavelength position of the Na I D lines and the red horizontal line is the null-absorption reference.
Current usage metrics show cumulative count of Article Views (full-text article views including HTML views, PDF and ePub downloads, according to the available data) and Abstracts Views on Vision4Press platform.
Data correspond to usage on the plateform after 2015. The current usage metrics is available 48-96 hours after online publication and is updated daily on week days.
Initial download of the metrics may take a while.