Free Access
Fig. B.1.
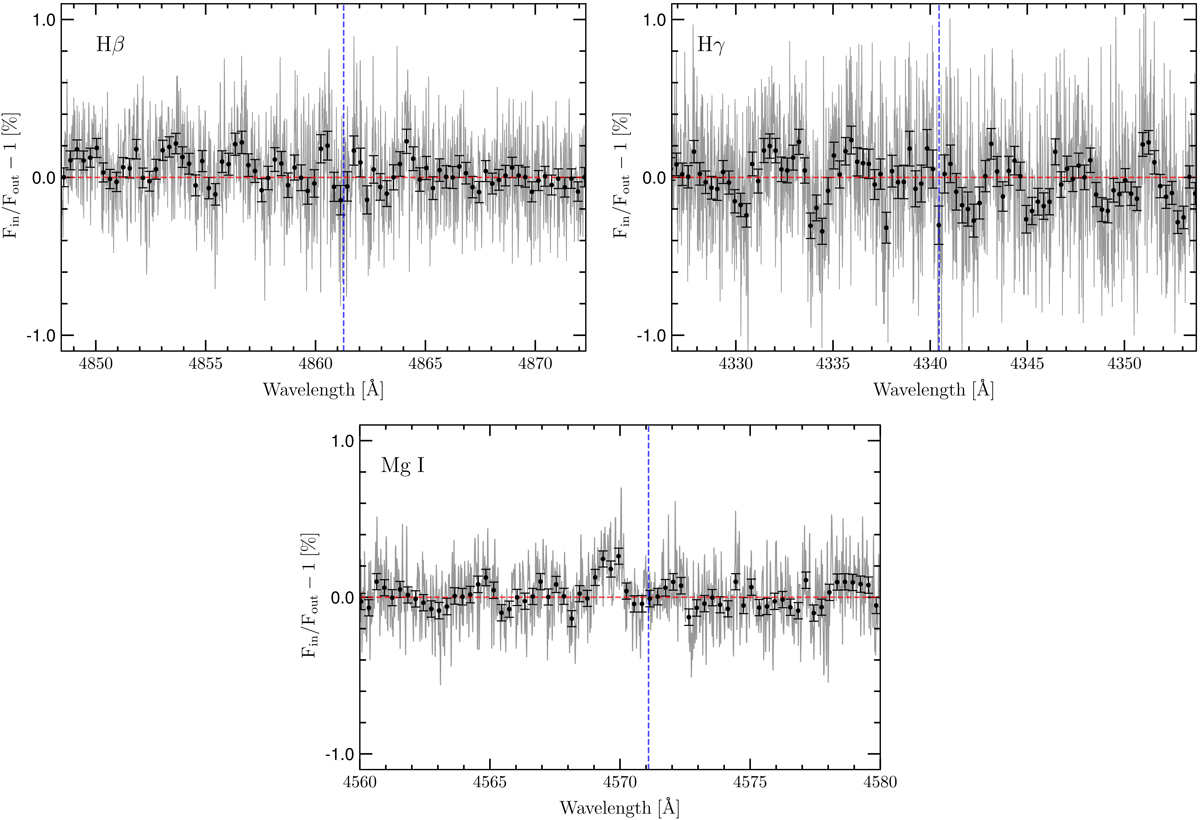
Transmission spectrum of MASCARA-2b atmosphere in the region of Hβ (top left), Hγ (top right), and Mg I (bottom). Transmission spectrum (light gray) and binned transmission spectrum by 30 pixels (black dots). The blue vertical line indicates the expected wavelength position in the planetary reference frame.
Current usage metrics show cumulative count of Article Views (full-text article views including HTML views, PDF and ePub downloads, according to the available data) and Abstracts Views on Vision4Press platform.
Data correspond to usage on the plateform after 2015. The current usage metrics is available 48-96 hours after online publication and is updated daily on week days.
Initial download of the metrics may take a while.