Fig. A.1.
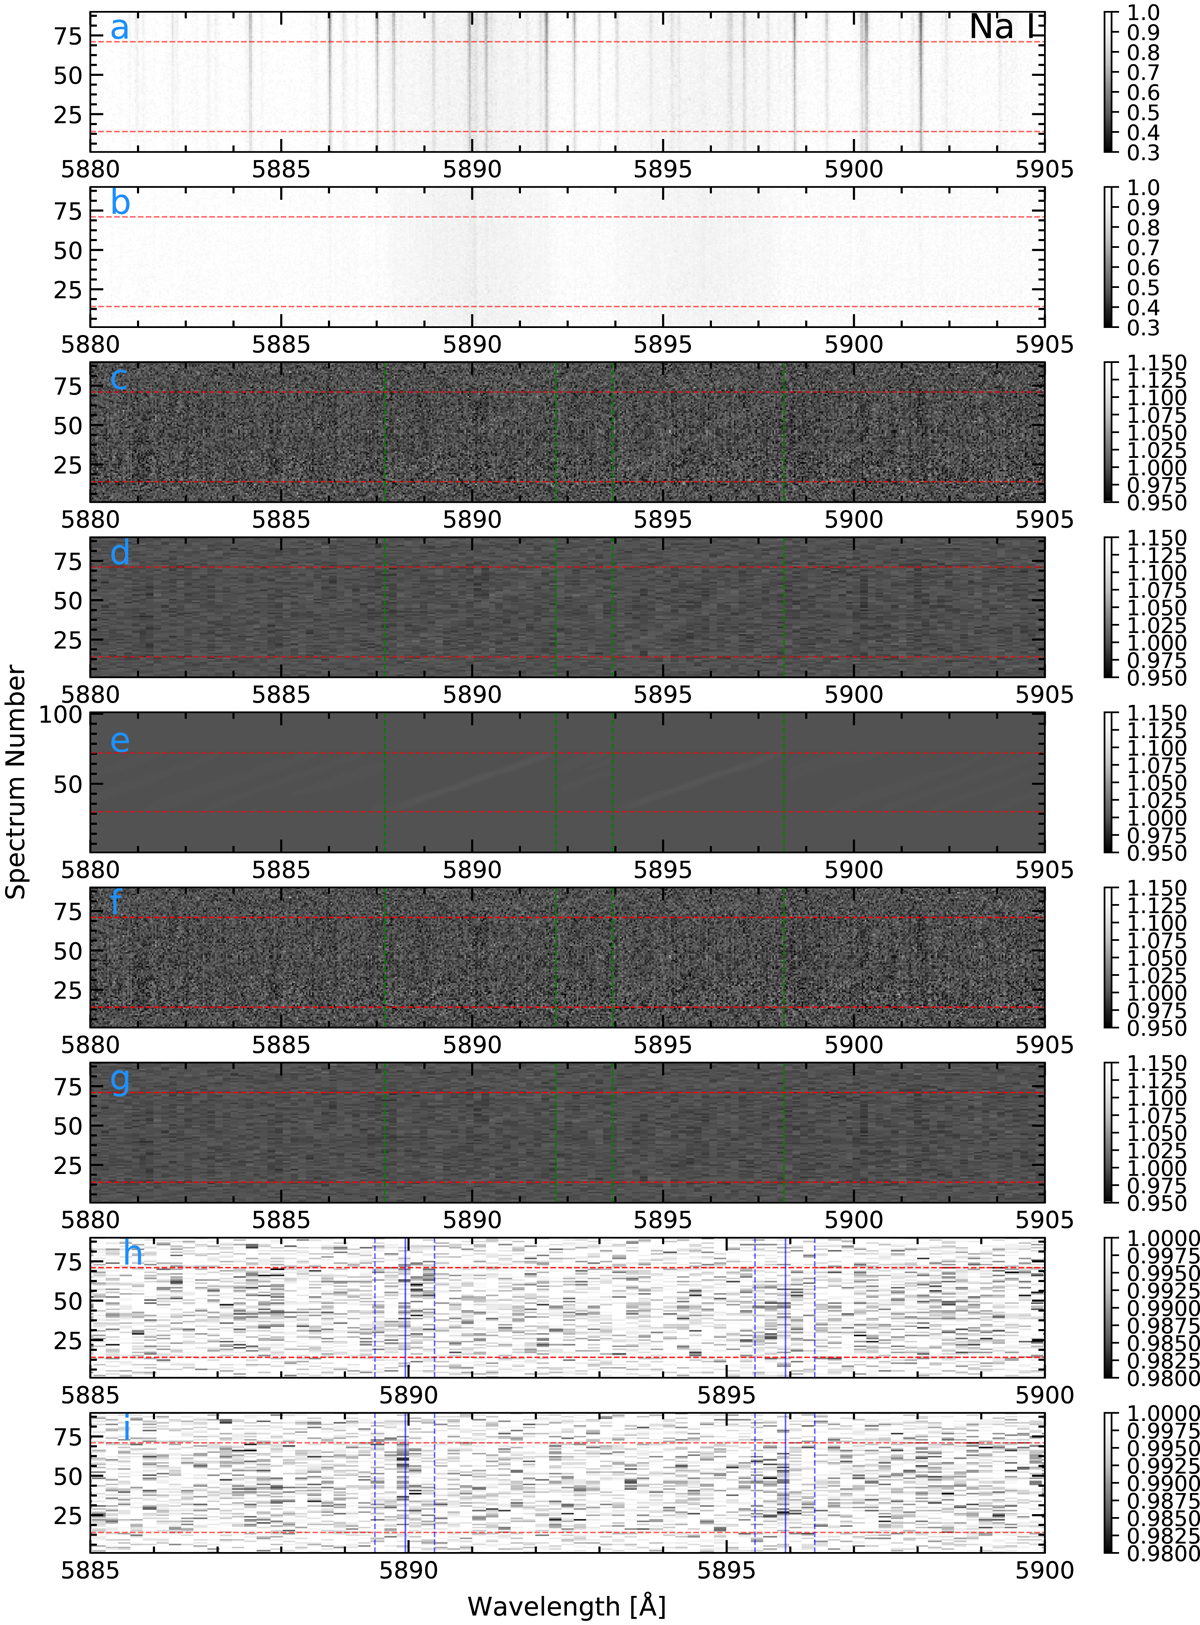
Two-dimensional representation of the MASCARA-2b spectra around Na I lines. The vertical axis of each panel represents the sequence number of the observed spectra (the time increases with the spectrum number); the red horizontal lines represent the limits between the in- and out-of-transit data. In the horizontal axis we present the wavelength in Å and the relative flux values are shown in the color bar. Panel a: original data after the normalization. Panel b: observed data after the telluric subtraction. Panels c, d, and e: residuals from the in-transit spectra and the master out spectrum ratio. The RM effect can be clearly observed in these panels. In panel d the data is binned by 20 pixels and in e we show the modeled RM residuals (without planetary absorption) obtained by applying to the modeled stellar spectra the same process as data from panels c and d. Panels f and g: residuals after correcting each single spectrum presented in c for the RM effect. We note in the process presented in Sect. 3 that the correction is applied to the final transmission spectrum after combining all In/Mout with the planet RV correction applied so as not to affect the planetary absorption. In panel g the data is binned by 20 pixels. The green vertical lines show the limits in wavelength of the RM effect (from −v sin i to +v sin i). Panel h: same as g decreasing the wavelength coverage and changing the contrast (see color-bar). Panels i: same as h after the planet RV correction. The blue vertical lines of panels h and i show the expected Na I position in wavelength due to the maximum and minimum RV of the planet during the transit (dashed line) and the mid-transit value, i.e., null RV (solid line).
Current usage metrics show cumulative count of Article Views (full-text article views including HTML views, PDF and ePub downloads, according to the available data) and Abstracts Views on Vision4Press platform.
Data correspond to usage on the plateform after 2015. The current usage metrics is available 48-96 hours after online publication and is updated daily on week days.
Initial download of the metrics may take a while.