| Issue |
A&A
Volume 616, August 2018
|
|
|---|---|---|
| Article Number | L10 | |
| Number of page(s) | 7 | |
| Section | Letters to the Editor | |
| DOI | https://doi.org/10.1051/0004-6361/201832930 | |
| Published online | 21 August 2018 | |
Letter to the Editor
ALMA observations of RCW 120 Fragmentation at 0.01 pc scale⋆
1
Aix Marseille Univ, CNRS, LAM, Laboratoire d’Astrophysique de Marseille, Marseille, France
e-mail: This email address is being protected from spambots. You need JavaScript enabled to view it.
2
Departamento de Astronomía, Universidad de Chile, Casilla 36-D, Santiago, Chile
3
Onsala Space Observatory, Sweden
Received:
1
March
2018
Accepted:
31
July
2018
Abstract
Context. Little is known about how high-mass stars form. Around 30% of the young high-mass stars in the Galaxy are observed at the edges of ionized (H II) regions. Therefore these are places of choice to study the earliest stages of high-mass star formation, especially toward the most massive condensations. High spatial resolution observations in the millimeter range might reveal how these stars form and how they assemble their mass.
Aims. We want to study the fragmentation process down to the 0.01 pc scale in the most massive condensation (1700 M⊙) observed at the southwestern edge of the H ii region RCW 120 where the most massive Herschel cores (~124 M⊙ in average) could form high-mass stars.
Methods. Using ALMA 3 mm continuum observations toward the densest and most massive millimetric condensation (Condensation 1) of RCW 120, we used the getimages and getsources algorithms to extract the sources detected with ALMA and obtained their physical parameters. The fragmentation of the Herschel cores is discussed through their Jeans mass to understand the properties of these future stars.
Results. We extracted 18 fragments from the ALMA continuum observation at 3 mm toward eight cores detected with Herschel, whose mass and deconvolved size range from 2 M⊙ to 32 M⊙ and from 1.6 mpc to 28.8 mpc, respectively. The low degree of fragmen- tation observed regarding thermal Jeans fragmentation suggests that the observed fragmentation is inconsistent with ideal gravitational fragmentation and other ingredients such as turbulence or magnetic fields should be added to explain this inconsistency. Finally, the range of the mass of the fragments indicates that the densest condensation of RCW 120 is a favorable place for the formation of high-mass stars with the presence of a probable UCH ii region associated with the 27 M⊙ Fragment 1 of Core 2.
Key words: H II regions / ISM: bubbles / photon-dominated region
The getsources catalog together with the configuration file are only available at the CDS via anonymous ftp to cdsarc.u-strasbg.fr (130.79.128.5) or via http://cdsarc.u-strasbg.fr/viz-bin/qcat?J/A+A/616/L10
© ESO 2018
1. Introduction
Despite decades of simulations and observational studies, the early stages of high-mass star formation are still poorly understood. Because high-mass stars shape the native cloud in which they form through feedback processes such as momentum injection through winds, heating, and photoionization via radiation, and violent supernova explosions, a deeper understanding of their whole evolution scenario is important. High-mass stars are known to form within gas condensation called clumps (~1 pc scale) and cores (~0.1 pc scale). These stars also form ionized (H II) regions whose expansion collects the surrounding molecular material, which can have positive (triggering mechanisms, Elmegreen & Lada 1977; Kessel-Deynet & Burkert 2003) or negative impact (Dale et al. 2005; Lucas et al. 2017) on local star formation. Even though about 30% of high-mass star formation in the Galaxy is observed at the edges of these H II regions (Deharveng et al. 2010; Kendrew et al. 2012, 2016; Palmeirim et al. 2017), the way these stars form and the efficiency of the possible triggering mechanisms are still debated (Dale et al. 2015; Palmeirim et al. 2017). Several observations of cores at a spatial resolution of 0.01 pc (Motte et al. 1998; Bontemps et al. 2010; Palau et al. 2015, 2018; Ohashi et al. 2018) were performed to study the properties of star formation but the lack of observations around H II regions prevent the study of their impact on a new generation of (high-mass) stars. Recent ALMA observations toward W43-MM1 at 2400 AU resolution (Motte et al. 2018) suggests that the core mass function (CMF) is top heavy and not self-similar to the initial mass function (IMF) contrary to low-mass star-forming regions such as ρ-Ophiuchi or the Aquila complex (Motte et al. 1998; Könyves et al. 2015). Moreover, studies have shown that turbulence (Padoan et al. 2001) and magnetic fields (Hennebelle & Teyssier 2008) are key ingredients that allow the structures to support the gravitational collapse above the thermal Jeans mass, allowing the formation of massive fragments ending with one or binary high-mass stars. The Galactic H ii region RCW 120 (Zavagno et al. 2007; Deharveng et al. 2009) represents a textbook example to study further the properties of star formation observed at its edges, where the most massive Herschel cores extracted and studied by Figueira et al. (2017) were observed with ALMA. In Sect. 2, we present the RCW 120 region and Condensation 1, Sect. 3 describes the ALMA observations used in this work with the data reduction process, Sect. 4 presents the analysis of the fragments and their properties, Sects. 5.1 and 5.2 discusses the fragmentation of the Herschel cores relative to the Jeans mass and the probability that high-mass stars emerge toward the photon dissociated region (PDR). Finally, Sect. 6 presents the conclusions of this work.
2. Galactic H II region RCW 120
RCW 120 (Rodgers et al. 1960) is a Galactic H II region ionized by a single O8V star (Martins et al. 2010) and located 0°̣5 above the Galactic plane at a distance of 1.3 kpc. Studied with Spitzer, Atacama Pathfinder Experiment (APEX) LABOCA, and Swedish-ESO Submillimetre Telescope (SEST) SIMBA (Zavagno et al. 2007; Deharveng et al. 2009), the latest study was made by Figueira et al. (2017) using the Herschel observations of OB young stellar objects (HOBYS) guaranteed time key program (Motte et al. 2010). A sample of 35 cores were extracted using the getsources algorithm (Men’shchikov et al. 2012; Men’shchikov 2013) from which the most massive and youngest objects are located toward the densest condensation (Condensation 1: 1700 M⊙ in 0.7 pc × 0.5 pc; see Fig. 1 top). Using the ALMA 12 m antennas, we observed the massive sources seen toward this condensation in order to understand how the Herschel cores are fragmented at 0.01 pc. In particular, we aim to understand if massive stars can be formed at the edges of this H II region.
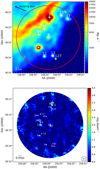 |
Fig. 1 Top: Herschel 70 µm image of Condensation 1 with the sources detected with the getimages-getsources algorithms from Figueira et al. (2017), the FoV of the ALMA observation presented in this work (red circle) and the direction where the ionizing star is located (black arrow). Bottom: 3 mm ALMA image of the fragments observed toward Condensation 1. |
3. ALMA observations and data reduction
The observations of Condensation 1 were performed during Cycle 4 using 38 of the 40 12 m ALMA antennas in nominal configuration C40-3 with baselines ranging from 15 m to 459 m. We used a continuum bandwidth of 2.227 GHz in Band 3 divided into 3 × 117.19 MHz (122 kHz–0.4 km s−1 resolution) + 1×1875 MHz bandwidth. The spectral bands were centered on 93.17, 91.98, 104.02, and 102.5 GHz allowing the observations of N2H+, CH3CN, SO2 transition lines and 3 mm continuum emission, respectively. The primary beam at the sky representative frequency of 104.03 GHz is 56″. The total observing time was 27.8 min with a system temperature between 46.7 K and 69.9 K and an average precipitable water vapor of 1.6 mm. For this work, we used the products delivered by ALMA. The imaging was performed with the CLEAN algorithm of the Common Astronomy Software Applications (CASA) package using a Briggs weighting with a robust parameter of 0.5 and a primary beam limit of 20%. The continuum emission was subtracted from all the spectral data cubes, and we ended up with a synthesized beam of 1″.7 × 1″.5 (0.01 pc at a distance of 1.3 kpc) and a rms noise level of 0.16 mJy beam−1 for the aggregate continuum (four spectral windows) and 4.6 mJy beam−1 for the SO2 and CH3CN molecular line transitions. After an inspection of the subtracted continuum and residual maps for each spectral window, the images made by the pipeline appear to be of good quality. The largest recoverable angular scale for these observations is 14″. In this Letter, we present the high-resolution 3 mm continuum observation toward Condensation 1 together with SO2and CH3CN spectroscopic observations toward one particular fragment. The other data will be presented in a forthcoming paper (Figueira et al., in prep.).
4. Results and analysis
The Herschel cores of RCW 120 (Figueira et al. 2017) were extracted with a new method using the getimages (Men’shchikov 2017) and getsources algorithms (see Appendix B for details). The properties of the Herschel cores were obtained using a spectral energy distribution (SED) fitting from 100 to 500 μm with the 160 or 250 μm flux mandatory to allow the aperture correction and better constrain the peak of the SED. The sources observed on the 3 mm ALMA image (Fig. 1 bottom) were extracted with the same algorithms and we found 18 ALMA sources, called fragments, in total. To quantify the loss of emission due to the spatial filtering of the interferometer, we performed a SED fitting from 100 to 500 μm (Herschel data). The integrated intensity expected at 3 mm in the primary beam area is 0.3 Jy, while the integrated intensity obtained from the observation is 0.06 Jy. Thus, we recover 20% of the emission with the ALMA 12 m observations while the emission above 14″ is filtered and lost. Using Herschel data, Figueira et al. (2017) found that the Herschel cores belonging to the Condensation 1 of RCW 120 are the youngest and most massive of the region with in average of 124 M⊙. Table 1 lists the properties of the Herschel cores detected by getsources. At a spatial resolution of 0.01 pc, the most massive core (Core 2, 376 M⊙) is also the most fragmented with five sources found inside (see Fig. A.1). No fragments are observed toward Core 17, 23, and 127, which could be explained by the dilution above the maximum recoverable spatial scale of the interferometer if the cores have not yet undergone gravitational collapse. A zoom on the 18 fragments inside the 8 cores are presented in Fig. A.1. Assuming optically thin emission, the mass of the fragments was calculated using the Hildebrand formula (Hildebrand 1983) Mfrag = S3 mm × R × D2/ κ3 mm × B3 mm(Tdust) × Ωbeam, where S3 mm is the integrated flux at 3 mm (in Jy), R is the gas-to-dust ratio assumed to be equal to 100, D is the distance to the region (in pc), B3 mm(Tdust) is the Planck function at 3 mm (in Jy sr−1) assuming a temperature Tdust (in K), Ω beam is the beam solid angle of the observation (in sr), and κ3 mm is the opacity at 3 mm assuming that κ3 mm= κ300 μm × (300 μm/3 mm)2and κ300 μm = 10 cm2 g−1 (Hildebrand 1983). Different opacity values can be taken depending on the model used and the physical conditions of the medium (Ossenkopf & Henning 1994; Preibisch et al. 1993). The choice of the opacity factor leads to a factor of 2 for the absolute mass uncertainty of the ALMA fragments (Martin et al. 2012; Deharveng et al. 2012; Csengeri et al. 2017). The temperature of the ALMA fragments is not well defined and most of the studies consider a temperature around ~20–25 K (Palau et al. 2014; Rathborne et al. 2015; Csengeri et al. 2017; Ginsburg et al. 2018). This temperature can be justified if we consider that star formation already began in the fragments but since we do yet not know their evolutionary stage, we compute the mass of the fragments assuming that they are at the same temperature as their hosting Herschel core (Louvet et al. 2018). The size of the fragments, computed as the geometrical mean of the major and minor angular size of the source, was deconvolved in quadrature with the beam angular resolution. The physical parameters of the ALMA sources are listed in Table 2.
Properties of the Herschel cores using the getsources (+getimages) algorithm.
Properties of the fragments detected with ALMA at 3 mm.
5. Discussion
5.1. Fragmentation inside the cores and thermal Jeans mass
In order to study the high-mass star formation process at the edges of H II regions, we use these high-resolution observations to characterize the fragmentation of the cores. When a core reaches the Jeans mass (MJeans), it becomes gravitationally unstable. We expect the mass of the fragments to be on the order of MJeans after the fragmentation process. This mass limit depends on the sound speed and density of the core; this can be translated into temperature and density (Jeans 1902; Kippenhahn et al. 2012) as follows: MJeans = 0.6285 × (Tenv/10K)1.5 × (nH2/105 cm−3)−0.5. The volume density of the Herschel cores was computed using the formula indicated in the footnote of Table 1. Since the size of several Herschel cores cannot be deconvolved, we assume a typical scale of 0.1 pc, which gives an upper limit for MJeans. The resulting MJeans for our Herschel cores are of the same order of magnitude compared to the massive cores studied in Palau et al. (2014) or Louvet et al. (2018) and range from 0.3 M⊙ to 2.5 M⊙ with an average of 0.8 M⊙ (see Table 1). From the mass of the cores and their corresponding MJeans, we would have expected the fragmentation seen at 0.01 pc resolution to be more important. In particular, three of the Herschel cores (17, 23 and 127) do not present any sign of fragmentation despite their associated low MJeans. Fragmentation at this spatial scale, referred to as multiplicity, has been observed by Lee et al. (2015) in L1448N and Palau et al. (2018) in OMC-1S for instance. Moreover, it is known that high-mass stars are often formed as part of a binary system (Zinnecker & Yorke 2007). Therefore, it is possible that our sample of ALMA sources are subfragmented at a scale below 0.01 pc. The additional increase of the temperature of the cores due to the heating provided by the proximity to the H II region (if any) appears to be insignificant in increasing the Jeans mass threshold. Most of the theoretical models related to fragmentation mechanisms consider other ingredients that are known to prevent fragmentation effectively such as turbulence (Padoan et al. 2001; Federrath et al. 2010) and the magnetic field (Girart et al. 2013; Fontani et al. 2016, 2018). In RCW 120, it has been shown that the compression of the H II region has an effect on the millimetric-wave condensation studied in this work through a column-density probability density function (PDF) analysis (Tremblin et al. 2014) and could have induced the gravitational collapse of the cores. We computed the expected Jeans mass accounting for the turbulence ( ) using the model of Mac Low & Klessen (2004) in which the compression resulting from supersonic turbulence increases the volume density of the cores by a factor equal to the square of the Mach number. The thermal velocity dispersion is computed assuming a temperature equal to the average temperature of the cores. The nonthermal velocity dispersion is then obtained by subtracting the thermal velocity dispersion from the N2H+(J = 1 → 0) velocity dispersion in quadrature (observed with the MALT90 survey at a spatial resolution of 30″−0.18 pc, Jackson et al. 2013). Assuming a Mach number of 4 in the PDR of RCW 120 (Tremblin et al. 2012), we obtain an upper limit of 100 M⊙ for the
  high enough to explain the mass of the fragments (Table 2).
5.2. High-mass star formation toward RCW 120
The millimetric-wave condensation studied in this work was the most promising place to search for the next generation of high-mass stars in RCW 120 since most of the massive cores observed with Herschel are located there. To find out whether high-mass star formation is likely to occur in the sample of Herschel cores, we used the criterion of Baldeschi et al. (2017) where high-mass star formation can begin only if Mcore > 1282 (r/[pc])1.42 M⊙. With a characteristic size of 0.1 pc, the mass limit at which a core can give rise to high-mass star is 50 M⊙. In the sample of Herschel cores, seven have a mass higher than this limit, accounting for the mass uncertainty of a factor of 2. Therefore, Cores 1, 2, 9, 10, 11, 15, and 39 host fragments that can potentially become high-mass stars depending on the star formation efficiency. Cores 17, 23, and 127 could form high-mass stars but no fragments are detected toward these objects, which means that the gravitational collapse has not occurred yet. In Fig. A.2, we show two other molecular lines observed at the same spatial resolution with a detection set at 3σ toward the most massive Herschel core. CH3CN is a tracer of hot cores during the early stage of star formation (Liu et al. 2015); SO2 is a good tracer of outflows (Wright et al. 1996; Minh et al. 2016) and is also associated with ultra compact (UC) H II regions (Minh et al. 2012; Zhang et al. 2014; Galván-Madrid et al. 2009). The presence of CH3CN and SO2 emission associated with the high-mass Fragment 1 (~27 M⊙) might indicate the presence of an UC H II region in the PDR of RCW 120. This phenomenom can be compared to the RCW 79 H II region in which a CH II region is clearly seen in the Midcourse Space Experiment (MSX) observation (Zavagno et al. 2006) toward the PDR. Most of the other fragments do not show any CH3CN/SO2 lines emission, which is a sign that the protostars are still forming and are in a earlier evolutionary stage compared to Fragment 1. Some of these fragments have a mass well above the 8 M⊙ limit and can potentially form high-mass stars. The low-mass fragments, showing no signs of stellar activity for the moment, however could accrete more mass from the molecular material contained in the core (Ohashi et al. 2016) allowing these objects to exceed the 8 M⊙ limit or form low-mass stars. The fragmentation occurring at a spatial resolution of 0.01 pc reveals a distribution of sources with a mass ranging from 2 to 32 M⊙ and an average of 12 M⊙ in RCW 120. Compared to ρ-Ophiuchi where no H II feedback is observed (Motte et al. 1998 with a resolution of 0.008 pc) the mass of the fragments in RCW 120 is around one order of magnitude higher, which could indicate that the H II region might favor the formation of high-mass stars. Nonetheless, Louvet et al. (2018) performed a recent ALMA follow-up of massive Herschel cores toward the high-mass star-forming region NGC 6334, where several H II regions are observed, with a spatial resolution of 5 mpc (half of the spatial resolution of our observations) and a sensitivity of 0.11 M⊙. While the size of the NGC 6334 fragments, extracted with getsources are comparable with the ALMA fragments in this study, the range of mass is completely different, from 0.2 to 2.6 M⊙, with an average of 0.9 ± 0.03 M⊙ for NGC 6334. Using the same spectral index as in their study (β = 1.5), the mass of the RCW 120 decreases but is still higher. In particular, the mass of Fragment 1 in Core 2 with this new spectral index is equal to 8 M⊙, which is still in agreement with a possible high-mass star associated with a UCH II region. Massive cores in this region have the potential to form high-mass stars and are subject to the H II region feedback but contrary to RCW 120, no fragments are massive enough to form high-mass stars at this moment. These two cases with opposite results indicate more observations are needed to understand the exact role of H II regions in the formation of high-mass stars. Other observations toward the TUKH122 prestellar core at 3 mm and OMC-1S at 1 mm and 0.01 pc resolution (Ohashi et al. 2018; Palau et al. 2018), where known H II regions are present (Balser et al. 2011), show an agreement with the thermal Jeans mechanism and a distribution of mass one order of magnitude lower compared to RCW 120.
6. Conclusions
Using the 12 m ALMA antennas, we observed the densest millimetric-wave condensation of RCW 120 where most of the massive cores are found. We studied the properties of the 18 ALMA fragments found inside the cores detected with Herschel whose mass goes up to 32 M⊙ with a detection limit of 0.12 M⊙. The cores host from 0 to 5 fragments. Core 2, which is the most massive, is the most fragmented. The high fragmentation expected from the Jeans instabilities is not observed toward these massive cores and is in favor of the formation of massive stars and addition of turbulence or magnetic field. CH3CN and SO2 emission are observed toward the main fragment in the most massive core arguing for the presence of an UCH II region in the PDR. Therefore, these new ALMA observations have shown that Condensation 1 of RCW 120 is a favorable place for the formation of high-mass stars.
Acknowledgments
LB acknowledges support from CONICYT Project PFB-06. This paper makes use of the following ALMA data: ADS/JAO.ALMA#2016.1.00314.S. ALMA is a partnership of ESO (representing its member states), NSF (USA) and NINS (Japan), together with NRC (Canada), MOST and ASIAA (Taiwan), and KASI (Republic of Korea), in cooperation with the Republic of Chile. The Joint ALMA Observatory is operated by ESO, AUI/NRAO, and NAOJ.
References
- Baldeschi, A., Elia, D., Molinari, S., et al. 2017, MNRAS, 466, 3682 [NASA ADS] [CrossRef] [Google Scholar]
- Balser, D. S., Rood, R. T., Bania, T. M., & Anderson, L. D. 2011, ApJ, 738, 27 [NASA ADS] [CrossRef] [Google Scholar]
- Bontemps, S., André, P., Könyves, V., et al. 2010, A&A, 518, L85 [Google Scholar]
- Csengeri, T., Bontemps, S., Wyrowski, F., et al. 2017, A&A, 600, L10 [NASA ADS] [CrossRef] [EDP Sciences] [Google Scholar]
- Dale, J. E., Bonnell, I. A., Clarke, C. J., & Bate, M. R. 2005, MNRAS, 358, 291 [NASA ADS] [CrossRef] [MathSciNet] [Google Scholar]
- Dale, J. E., Haworth, T. J., & Bressert, E. 2015, MNRAS, 450, 1199 [NASA ADS] [CrossRef] [Google Scholar]
- Deharveng, L., Zavagno, A., Schuller, F., et al. 2009, A&A, 496, 177 [NASA ADS] [CrossRef] [EDP Sciences] [Google Scholar]
- Deharveng, L., Schuller, F., Anderson, L. D., et al. 2010, A&A, 523, A6 [NASA ADS] [CrossRef] [EDP Sciences] [Google Scholar]
- Deharveng, L., Zavagno, A., Anderson, L. D., et al. 2012, A&A, 546, A74 [NASA ADS] [CrossRef] [EDP Sciences] [Google Scholar]
- Elmegreen, B. G., & Lada, C. J. 1977, ApJ, 214, 725 [NASA ADS] [CrossRef] [Google Scholar]
- Federrath, C., Duval, J., Klessen, R. S., Schmidt, W., & Low, M.-M. M. 2010, Highlights Astron., 15, 404 [NASA ADS] [Google Scholar]
- Figueira, M., Zavagno, A., Deharveng, L., et al. 2017, A&A, 600, A93 [NASA ADS] [CrossRef] [EDP Sciences] [Google Scholar]
- Fontani, F., Commerçon, B., Giannetti, A., et al. 2016, A&A, 593, L14 [NASA ADS] [CrossRef] [EDP Sciences] [Google Scholar]
- Fontani, F., Commerçon, B., Giannetti, A., et al. 2018, A&A, 615, A94 [NASA ADS] [CrossRef] [EDP Sciences] [Google Scholar]
- Galván-Madrid, R., Keto, E., Zhang, Q., et al. 2009, ApJ, 706, 1036 [NASA ADS] [CrossRef] [Google Scholar]
- Ginsburg, A. G., Bally, J., Barnes, A., et al. 2018, ApJ, 853, 171 [NASA ADS] [CrossRef] [Google Scholar]
- Girart, J. M., Frau, P., Zhang, Q., et al. 2013, ApJ, 772, 69 [NASA ADS] [CrossRef] [Google Scholar]
- Hennebelle, P., & Teyssier, R. 2008, A&A, 477, 25 [NASA ADS] [CrossRef] [EDP Sciences] [Google Scholar]
- Hildebrand, R. H. 1983, QJRAS, 24, 267 [NASA ADS] [Google Scholar]
- Jackson, J. M., Rathborne, J. M., Foster, J. B., et al. 2013, PASA, 30, e057 [NASA ADS] [CrossRef] [Google Scholar]
- Jeans, J. H. 1902, Phil. Trans. R. Soc. London, Ser. A, 199, 1 [Google Scholar]
- Kendrew, S., Simpson, R., Bressert, E., et al. 2012, ApJ, 755, 71 [NASA ADS] [CrossRef] [Google Scholar]
- Kendrew, S., Beuther, H., Simpson, R., et al. 2016, ApJ, 825, 142 [NASA ADS] [CrossRef] [Google Scholar]
- Kessel-Deynet, O., & Burkert, A. 2003, MNRAS, 338, 545 [NASA ADS] [CrossRef] [Google Scholar]
- Kippenhahn, R., Weigert, A., & Weiss, A. 2012, Stellar Struct. Evol. [Google Scholar]
- Könyves, V., André, P., Men’shchikov, A., et al. 2015, A&A, 584, A91 [NASA ADS] [CrossRef] [EDP Sciences] [Google Scholar]
- Lee, K. I., Dunham, M. M., Myers, P. C., et al. 2015, ApJ, 814, 114 [NASA ADS] [CrossRef] [Google Scholar]
- Liu, H.-L., Wu, Y., Li, J., et al. 2015, ApJ, 798, 30 [NASA ADS] [CrossRef] [Google Scholar]
- Louvet, F., Neupane, S., Motte, F., et al. 2018, A&A, submitted [Google Scholar]
- Lucas, W. E., Bonnell, I. A., & Forgan, D. H. 2017, MNRAS, 466, 5011 [NASA ADS] [Google Scholar]
- Mac Low, M.-M., & Klessen, R. S. 2004, Rev. Mod. Phys., 76, 125 [NASA ADS] [CrossRef] [Google Scholar]
- Martin, P. G., Roy, A., Bontemps, S., et al. 2012, ApJ, 751, 28 [NASA ADS] [CrossRef] [Google Scholar]
- Martins, F., Pomarès, M., Deharveng, L., Zavagno, A., & Bouret, J. C. 2010, A&A, 510, A32 [NASA ADS] [CrossRef] [EDP Sciences] [Google Scholar]
- Men’shchikov, A. 2013, A&A, 560, A63 [NASA ADS] [CrossRef] [EDP Sciences] [Google Scholar]
- Men’shchikov, A. 2017, A&A, 607, A64 [NASA ADS] [CrossRef] [EDP Sciences] [Google Scholar]
- Men’shchikov, A., André, P., Didelon, P., et al. 2012, A&A, 542, A81 [NASA ADS] [CrossRef] [EDP Sciences] [Google Scholar]
- Minh, Y. C., Chen, H.-R., Su, Y.-N., & Liu, S.-Y. 2012, J. Korean Astron. Soc., 45, 157 [NASA ADS] [CrossRef] [Google Scholar]
- Minh, Y. C., Liu, H. B., & Galvań-Madrid, R. 2016, ApJ, 824, 99 [NASA ADS] [CrossRef] [Google Scholar]
- Motte, F., Andre, P., & Neri, R. 1998, A&A, 336, 150 [NASA ADS] [Google Scholar]
- Motte, F., Zavagno, A., Bontemps, S., et al. 2010, A&A, 518, L77 [NASA ADS] [CrossRef] [EDP Sciences] [Google Scholar]
- Motte, F., Nony, T., Louvet, F., et al. 2018, Nat. Astron., 2, 478 [NASA ADS] [CrossRef] [Google Scholar]
- Ohashi, S., Sanhueza, P., Chen, H.-R. V., et al. 2016, ApJ, 833, 209 [NASA ADS] [CrossRef] [Google Scholar]
- Ohashi, S., Sanhueza, P., Sakai, N., et al. 2018, ApJ, 856, 147 [NASA ADS] [CrossRef] [Google Scholar]
- Ossenkopf, V., & Henning, T. 1994, A&A, 291, 943 [NASA ADS] [Google Scholar]
- Padoan, P., Nordlund, Å., Rögnvaldsson, Ö. E., & Goodman, A. 2001, in From Darkness to Light: Origin and Evolution of Young Stellar Clusters, eds. T. Montmerle, & P. André, Astronomical Society of the Pacific Conference Series, 243, 279 [NASA ADS] [Google Scholar]
- Palau, A., Estalella, R., Girart, J. M., et al. 2014, ApJ, 785, 42 [NASA ADS] [CrossRef] [Google Scholar]
- Palau, A., Ballesteros-Paredes, J., Vázquez-Semadeni, E., et al. 2015, MNRAS, 453, 3785 [NASA ADS] [CrossRef] [Google Scholar]
- Palau, A., Zapata, L. A., Román-Zúñiga, C. G., et al. 2018, ApJ, 855, 24 [NASA ADS] [CrossRef] [Google Scholar]
- Palmeirim, P., Zavagno, A., Elia, D., et al. 2017, A&A, 605, A35 [NASA ADS] [CrossRef] [EDP Sciences] [Google Scholar]
- Preibisch, T., Ossenkopf, V., Yorke, H. W., & Henning, T. 1993, A&A, 279, 577 [NASA ADS] [Google Scholar]
- Rathborne, J. M., Longmore, S. N., Jackson, J. M., et al. 2015, ApJ, 802, 125 [NASA ADS] [CrossRef] [Google Scholar]
- Rodgers, A. W., Campbell, C. T., & Whiteoak, J. B. 1960, MNRAS, 121, 103 [NASA ADS] [CrossRef] [Google Scholar]
- Tigé, J., Motte, F., Russeil, D., et al. 2017, A&A, 602, A77 [NASA ADS] [CrossRef] [EDP Sciences] [Google Scholar]
- Tremblin, P., Audit, E., Minier, V., Schmidt, W., & Schneider, N. 2012, A&A, 546, A33 [NASA ADS] [CrossRef] [EDP Sciences] [Google Scholar]
- Tremblin, P., Schneider, N., Minier, V., et al. 2014, A&A, 564, A106 [NASA ADS] [CrossRef] [EDP Sciences] [Google Scholar]
- Wright, M. C. H., Plambeck, R. L., & Wilner, D. J. 1996, ApJ, 469, 216 [NASA ADS] [CrossRef] [Google Scholar]
- Zavagno, A., Deharveng, L., Comerón, F., et al. 2006, A&A, 446, 171 [NASA ADS] [CrossRef] [EDP Sciences] [Google Scholar]
- Zavagno, A., Pomarès, M., Deharveng, L., et al. 2007, A&A, 472, 835 [NASA ADS] [CrossRef] [EDP Sciences] [Google Scholar]
- Zhang, C.-P., Wang, J.-J., Xu, J.-L., Wyrowski, F., & Menten, K. M. 2014, ApJ, 784, 107 [NASA ADS] [CrossRef] [Google Scholar]
- Zinnecker, H., & Yorke, H. W. 2007, ARA&A, 45, 481 [Google Scholar]
Appendix A
Images of ALMA fragments for each core
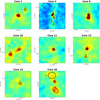 |
Fig. A.1. ALMA sources extracted with getsources (black ellipses) for each of the Herschel cores at 3 mm. |
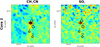 |
Fig. A.2. Integrated emission of the CH3CN and SO2 molcular lines toward the Herschel Core 2. |
Appendix B
getsources extraction
The getsources algorithm is a multiwavelength, multiscale extraction program used to extract compact sources and filaments through a single-scale decomposition approach. The original images were processed using the prepareobs script, which creates a set of images used for the detection and measurements steps. Firstly, getsources decomposes the images at each wavelength into a set of single spatial scales. Sources whose sizes do not correspond to the spatial scale are filtered while the visibility of the others is enhanced. This sample of images is then cleaned using an intensity thresholding method. Once the cleaning is done, each set of single spatial scale images are combined to form independent wavelength images. In practice, two sets of combined images are created: one to follow the evolution of the shape of the source (footprint) and the other to follow the evolution of the peak intensity. Finally, the algorithm looks for every set in the form of four connected pixels and assigns a source identification number to each of these. The second main step of the process consists of measuring the properties of each detected source and at each wavelength. In order to improve the detection and measurements of the sources, a new set of flat detection images are created using the results from the first pass in getsources. The entire steps of detections and measurements mentioned above are performed again using these flat images as input detection images.
Recently, extractions made with the getsources algorithm were improved using getimages, which replaces the first pass in getsources. Using a median filtering on multiple spatial scales ranging from the observational beam to the maximal size of the structures that we want to detect, getimages provides a background-subtracted flattened image where the small-scale fluctuations outside the structures of interest are uniform. Based on that image and on the maximal size of the structures one wants to extract, the getsources algorithm is used to obtain the catalog of sources together with their properties. The Herschel cores from Figueira et al. (2017) were extracted using the getsources algorithm and the HOBYS recipe (Tigé et al. 2017). Since the use of getimages improves the quality of the final detections catalog compared to the previous extractions, the cores were extracted again following the new strategy by combining the getsources and getimages algorithms as well as the ALMA fragments. For this work, we used getimages (Version 2.171128) with the default parameters and a maximal size of the structures set to 2″ , as well as getsources (Version 1.140127) with the default parameters. The configuration files of getimages and getsources can be found, together with the catalog, on the CDS and more explanations about the parameters can be found in Men’shchikov et al. (2012) and Men’shchikov (2017). While 13 cores are found in the former extraction (getsources only), only 10 cores are listed in the new Herschel catalog (getsources & getimages). The Core 58 is not detected in the new extraction and Core 15 and 37 are detected but not selected because of the lack of reference flux for the aperture correction that is mandatory in the HOBYS recipe. Nonetheless, since an ALMA source is found for the Core 15, we keep it for our analysis. However, it is important to remember that no aperture correction was made for the SED of this source, which could lead to higher uncertainties for its derived physical properties.
All Tables
All Figures
|
Fig. 1 Top: Herschel 70 µm image of Condensation 1 with the sources detected with the getimages-getsources algorithms from Figueira et al. (2017), the FoV of the ALMA observation presented in this work (red circle) and the direction where the ionizing star is located (black arrow). Bottom: 3 mm ALMA image of the fragments observed toward Condensation 1. |
| In the text | |
|
Fig. A.1. ALMA sources extracted with getsources (black ellipses) for each of the Herschel cores at 3 mm. |
| In the text | |
|
Fig. A.2. Integrated emission of the CH3CN and SO2 molcular lines toward the Herschel Core 2. |
| In the text | |
Current usage metrics show cumulative count of Article Views (full-text article views including HTML views, PDF and ePub downloads, according to the available data) and Abstracts Views on Vision4Press platform.
Data correspond to usage on the plateform after 2015. The current usage metrics is available 48-96 hours after online publication and is updated daily on week days.
Initial download of the metrics may take a while.