Free Access
Fig. 9
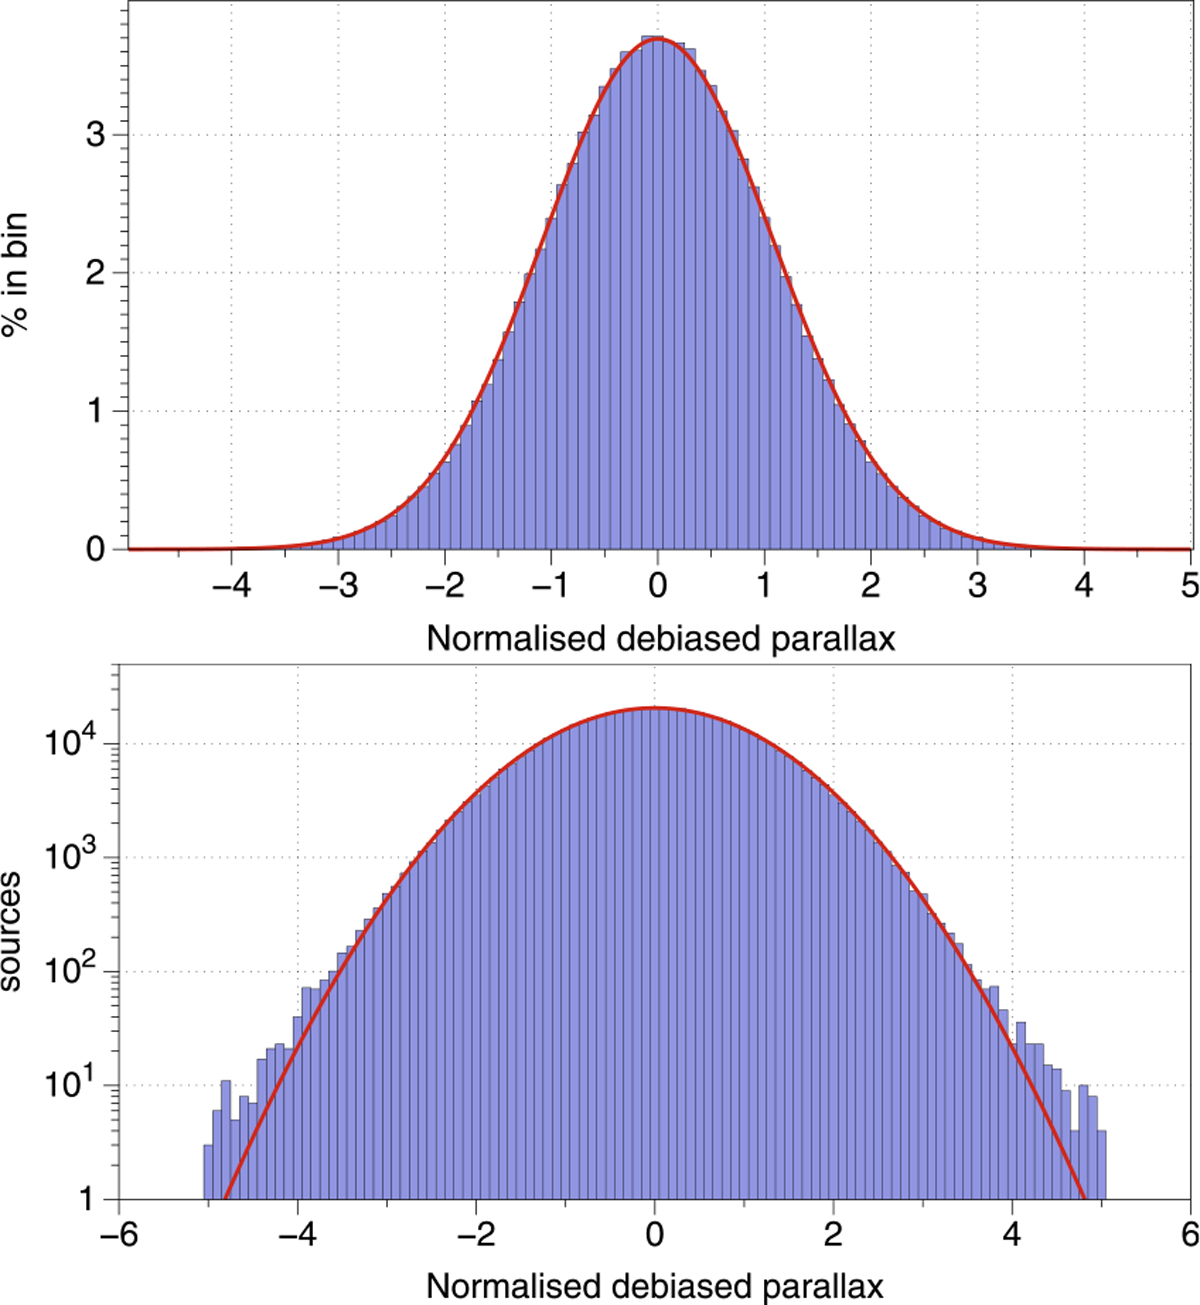
Distribution of the normalised debiased parallaxes, (ϖ + 0.029 mas)∕σϖ, for the Gaia-CRF2 quasars in linear scale (top) and logarithmic (bottom). The red curve is a normal distribution with zero mean and standard deviation 1.08.
Current usage metrics show cumulative count of Article Views (full-text article views including HTML views, PDF and ePub downloads, according to the available data) and Abstracts Views on Vision4Press platform.
Data correspond to usage on the plateform after 2015. The current usage metrics is available 48-96 hours after online publication and is updated daily on week days.
Initial download of the metrics may take a while.