Fig. 2
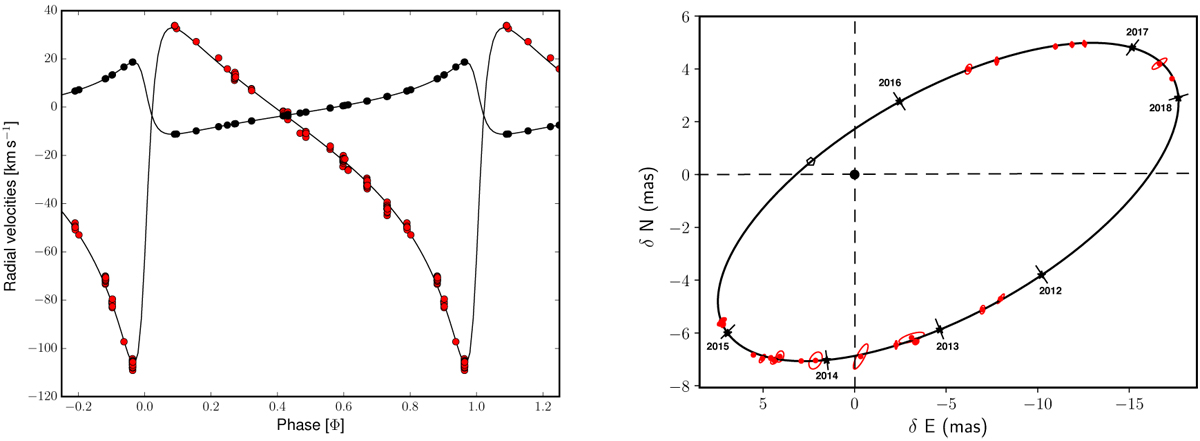
Left panel: RV curves of the outer system. Black dots represent the systemic velocities of the inner (P+S) system whilst the red ones represent the tertiary component. Right panel: relative astrometric orbit of the tertiary component in the outer system; the inner system is considered as fixed at (0,0). The periastron of the tertiary is represented by an open pentagon symbol. The observations are indicated in red and are accompanied with their error ellipses.
Current usage metrics show cumulative count of Article Views (full-text article views including HTML views, PDF and ePub downloads, according to the available data) and Abstracts Views on Vision4Press platform.
Data correspond to usage on the plateform after 2015. The current usage metrics is available 48-96 hours after online publication and is updated daily on week days.
Initial download of the metrics may take a while.