Fig. 4
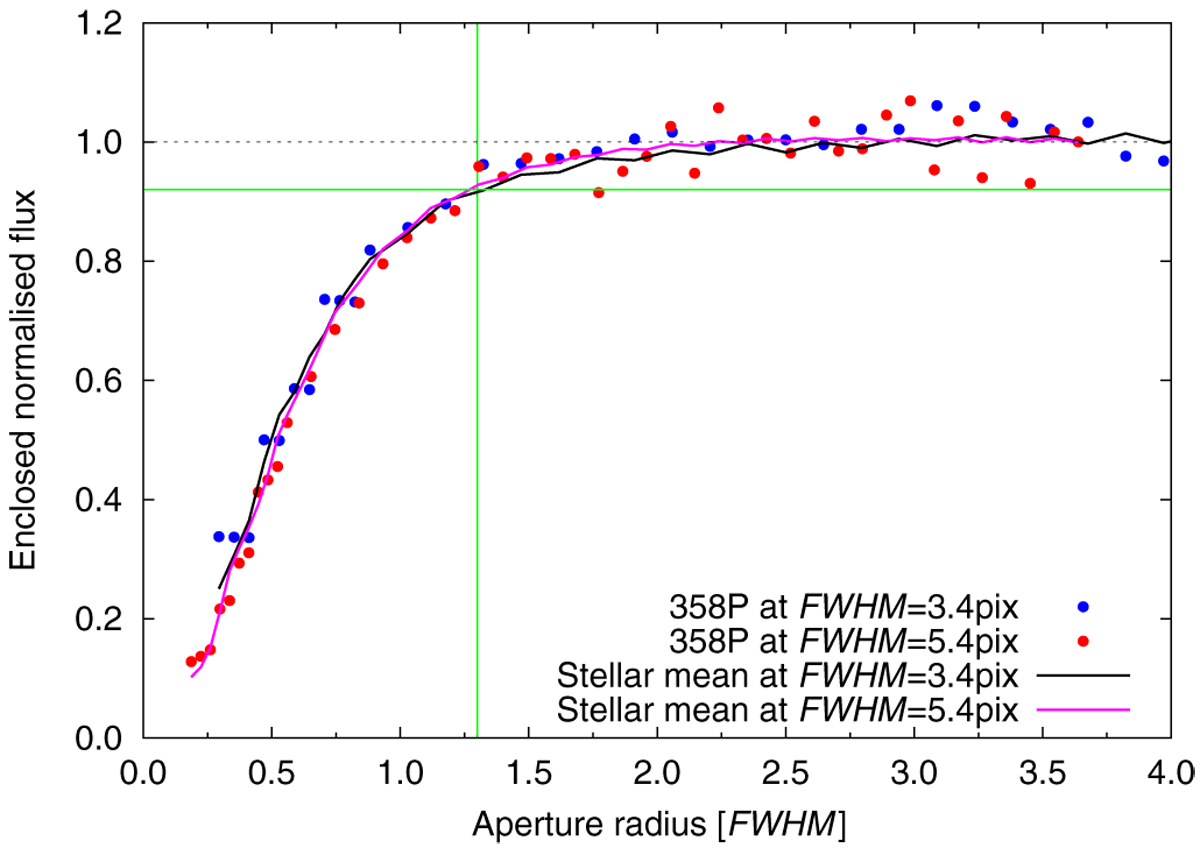
Normalised radial profiles of 358P and field stars in the FORS2 data, measured for two different values of the seeing FWHM, D. The green lines indicate the aperture radius in which the light curve (Fig. 1) was measured and the corresponding flux level of 92%. The x-axis is in units of the FWHM at observation, i.e. a unit interval corresponds to 3.4 pixels for the blue dots and 5.4 pixels for the red dots.
Current usage metrics show cumulative count of Article Views (full-text article views including HTML views, PDF and ePub downloads, according to the available data) and Abstracts Views on Vision4Press platform.
Data correspond to usage on the plateform after 2015. The current usage metrics is available 48-96 hours after online publication and is updated daily on week days.
Initial download of the metrics may take a while.