Fig. 8
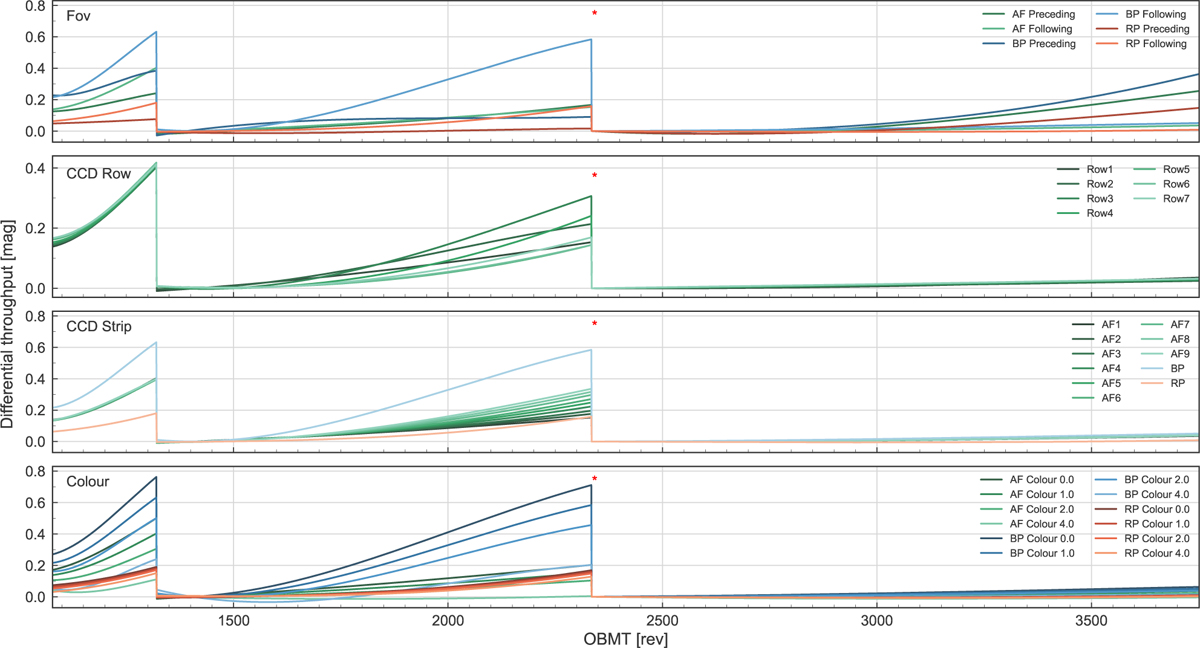
Differential throughput Δτ (see Eq. (3)) w.r.t. 2335 rev as a function of time, the reference epoch is indicated by the red asterisk. First panel: variation in throughput for the two FoV in CCD row 1 for AF1 (green), BP (blue), and RP (red) showing larger contamination in the following FoV at least up to the second decontamination. Second panel: variation in throughput for AF1 and following FoV for different CCD rows showing stronger contamination in the bottom part of the focal plane (low CCD row number). The range of the ordinate axis in this panel is more compressed since it does not show BP and RP. Third panel: variation in throughput in the following FoV for all CCDs in row 1 showing an increase in contamination from AF1 to AF9; the maximum effect is in BP and the lowest effect in RP, as expected. Fourth panel: variation in throughput in the following FoV, CCD row 1 for AF1, BP, and RP and different source colours showing that bluer sources are more heavily affected by contamination, hence the overall much larger systematic in the BP band.
Current usage metrics show cumulative count of Article Views (full-text article views including HTML views, PDF and ePub downloads, according to the available data) and Abstracts Views on Vision4Press platform.
Data correspond to usage on the plateform after 2015. The current usage metrics is available 48-96 hours after online publication and is updated daily on week days.
Initial download of the metrics may take a while.