Fig. 10
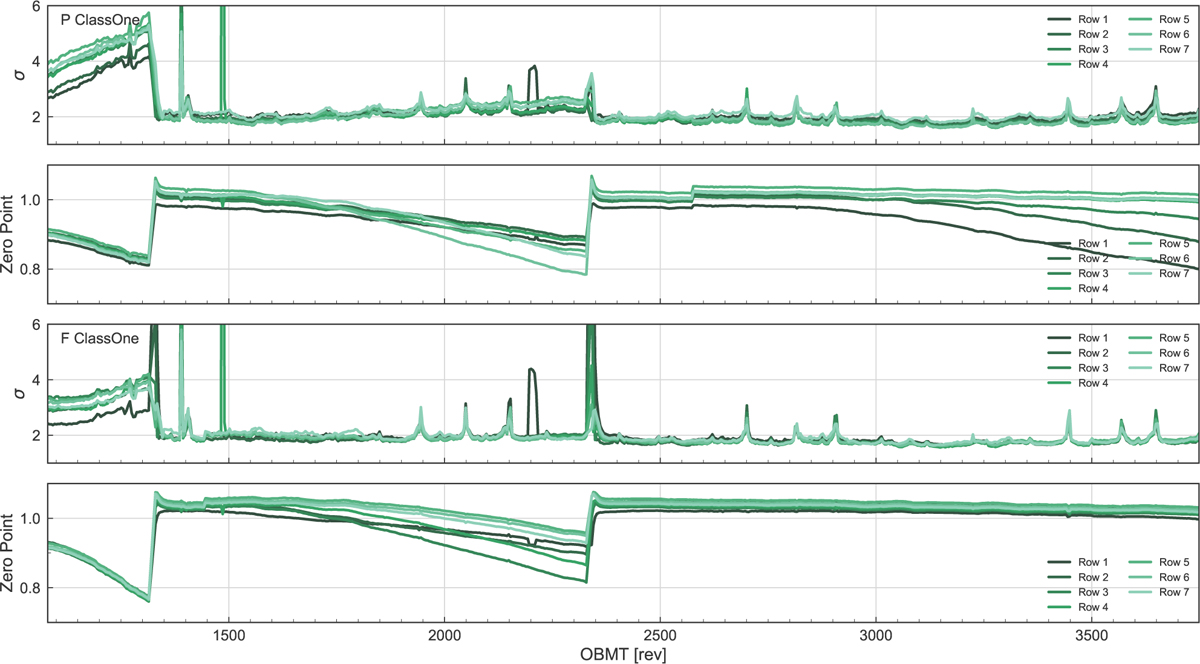
Time evolution of the LS calibration standard deviation (sigma) and zero point for the preceding FoV (panels 1 and 2, respectively) and following FoV (panels 3 and 4, respectively) for each CCD row. All solutions only consider the ungated AF1 observations acquired with window class 1 (corresponding approximately to 13 < G < 16). The two decontaminations are clearly visible in both FoVs as a major discontinuity in the calibration zero point. The first refocus can be seen as a very small step in the zero point for the following FoV, whereas the second refocus is more visible as a slightly larger step in the zero point for the preceding FoV. Additional features visible in both the standard deviation and zero point are discussed in the text.
Current usage metrics show cumulative count of Article Views (full-text article views including HTML views, PDF and ePub downloads, according to the available data) and Abstracts Views on Vision4Press platform.
Data correspond to usage on the plateform after 2015. The current usage metrics is available 48-96 hours after online publication and is updated daily on week days.
Initial download of the metrics may take a while.