Fig. 9.
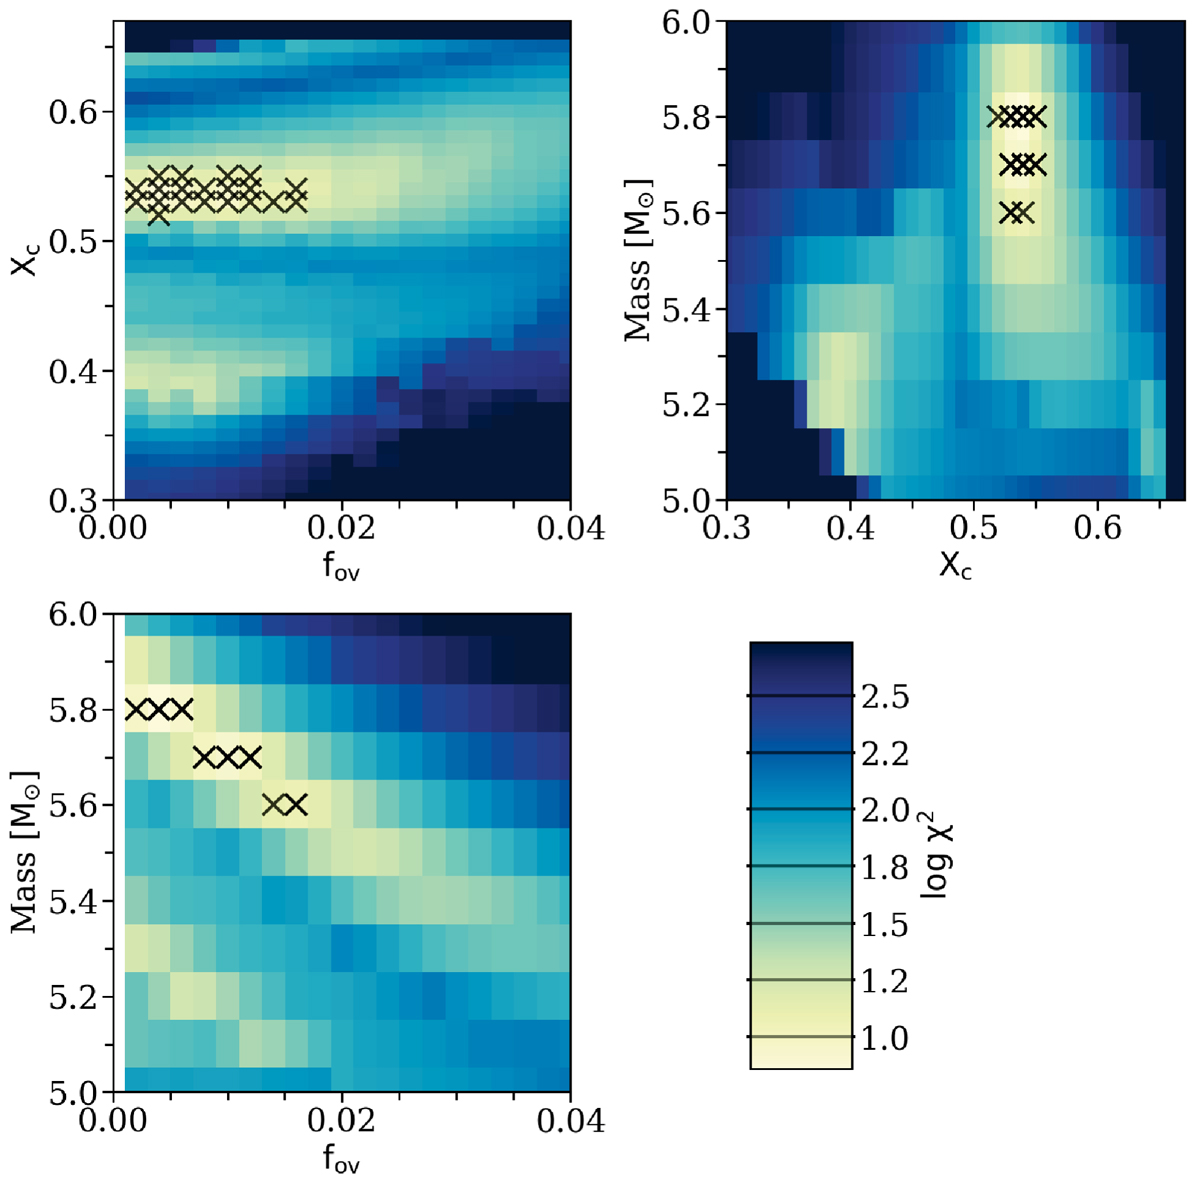
Color maps indicating the pairwise (marginalized) correlation between the parameters in the (fine) grid of MESA models. Top left: correlation between Xc and fov after marginalizing over M⋆. Top right: correlation between M⋆ and Xc after marginalizing over fov. Bottom left: correlation between M⋆ and fov after marginalizing over Xc, indicating the strong correlation caused by models with the ΔΠ same value. The same color scale was used for all panels. The 20 best MESA models are indicated by the black crosses.
Current usage metrics show cumulative count of Article Views (full-text article views including HTML views, PDF and ePub downloads, according to the available data) and Abstracts Views on Vision4Press platform.
Data correspond to usage on the plateform after 2015. The current usage metrics is available 48-96 hours after online publication and is updated daily on week days.
Initial download of the metrics may take a while.