Fig. 8.
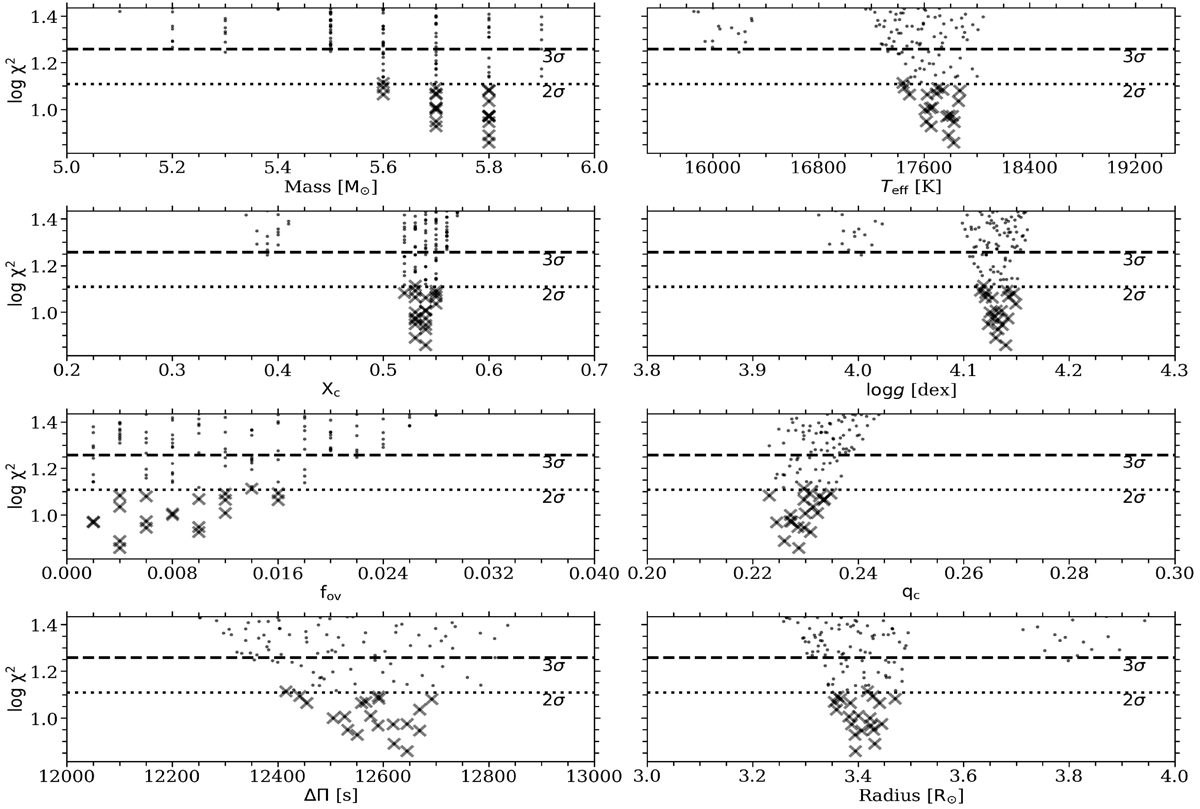
Distribution of the χ2 values, computed during the forward seismic modeling of HD 43317 based on 16 of the 28 observed frequencies, using the refined grid of MESA models. The χ2 values for the 2σ and 3σ confidence intervals are indicated by the dotted and dashed black lines, respectively. The best 20 models are indicated by the black crosses. We refer to Table 2 for the description of the physical quantities.
Current usage metrics show cumulative count of Article Views (full-text article views including HTML views, PDF and ePub downloads, according to the available data) and Abstracts Views on Vision4Press platform.
Data correspond to usage on the plateform after 2015. The current usage metrics is available 48-96 hours after online publication and is updated daily on week days.
Initial download of the metrics may take a while.