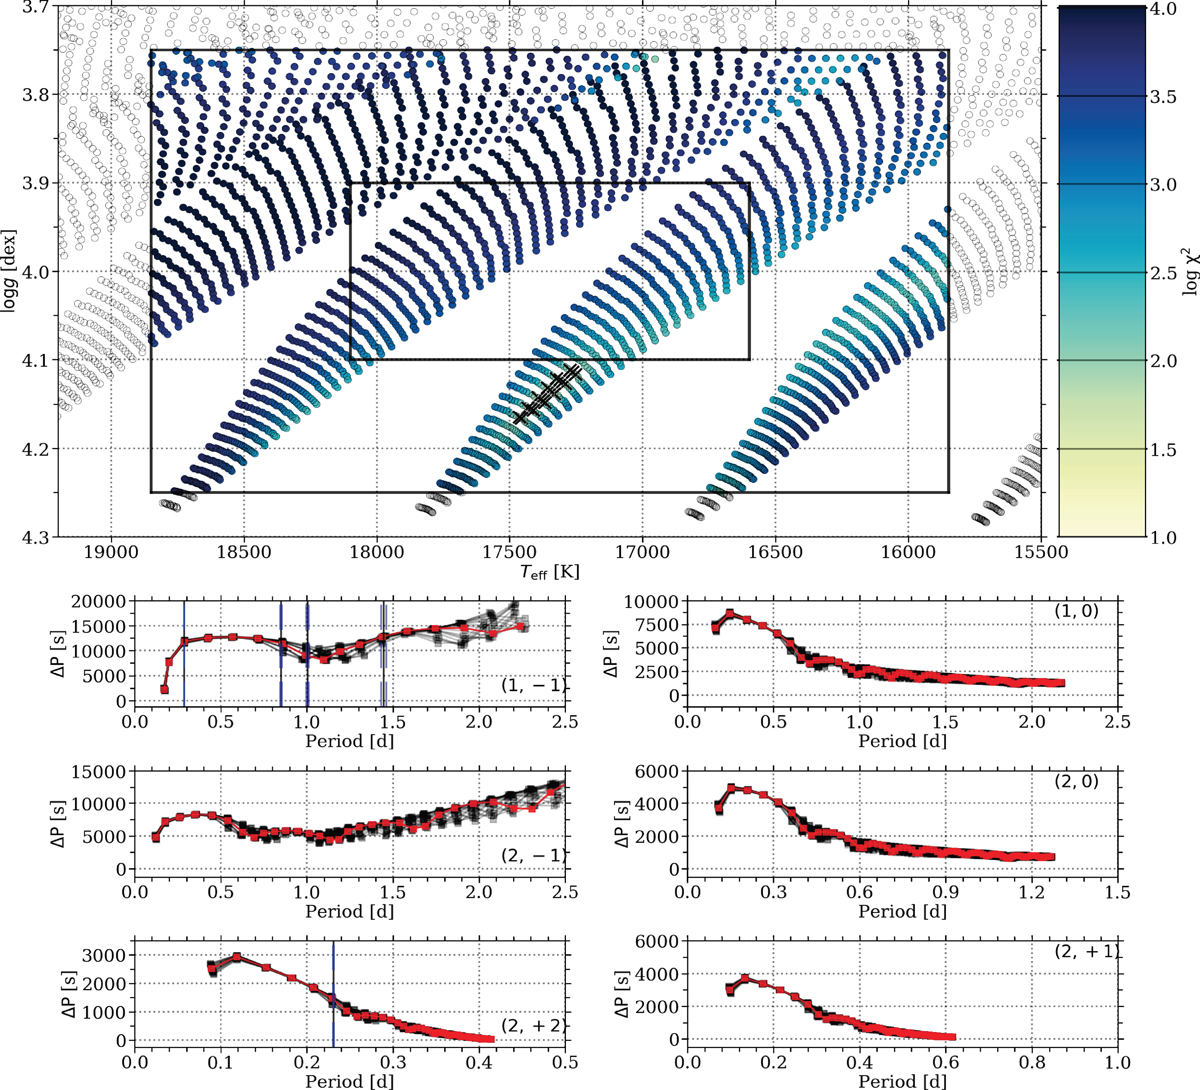
Fig. 4.

Summary plot for the results of the forward modeling of HD 43317 based on the dipole mode hypothesis (see text). Top: Kiel diagram showing the location of the MESA models whose GYRE frequencies come closest to the detected frequencies. The color scale represents the χ2 value (see Eq. (1)), the open symbols indicate MESA models outside the spectroscopic limits of the star deduced by Pápics et al. (2012, with the 1σ and 2σ limits indicated by the black boxes) and the black crosses represent the location of the 20 best fitting MESA models. Bottom panels: period spacing patterns of the 20 best fitting MESA models for various mode geometries (black lines and squares). Those of the best description are shown in red. The observed pulsation mode periods used in the χ2 are indicated by the vertical gray lines, while the vertical blue regions indicate the observed period range taking into account the Rayleigh limit of the data. Only (1, −1) modes (i.e., f4, f9, f13, and f29, as well as the f31 as a (2, +2) mode) were relied upon to achieve the frequency matching.
Current usage metrics show cumulative count of Article Views (full-text article views including HTML views, PDF and ePub downloads, according to the available data) and Abstracts Views on Vision4Press platform.
Data correspond to usage on the plateform after 2015. The current usage metrics is available 48-96 hours after online publication and is updated daily on week days.
Initial download of the metrics may take a while.


