Fig. 2.
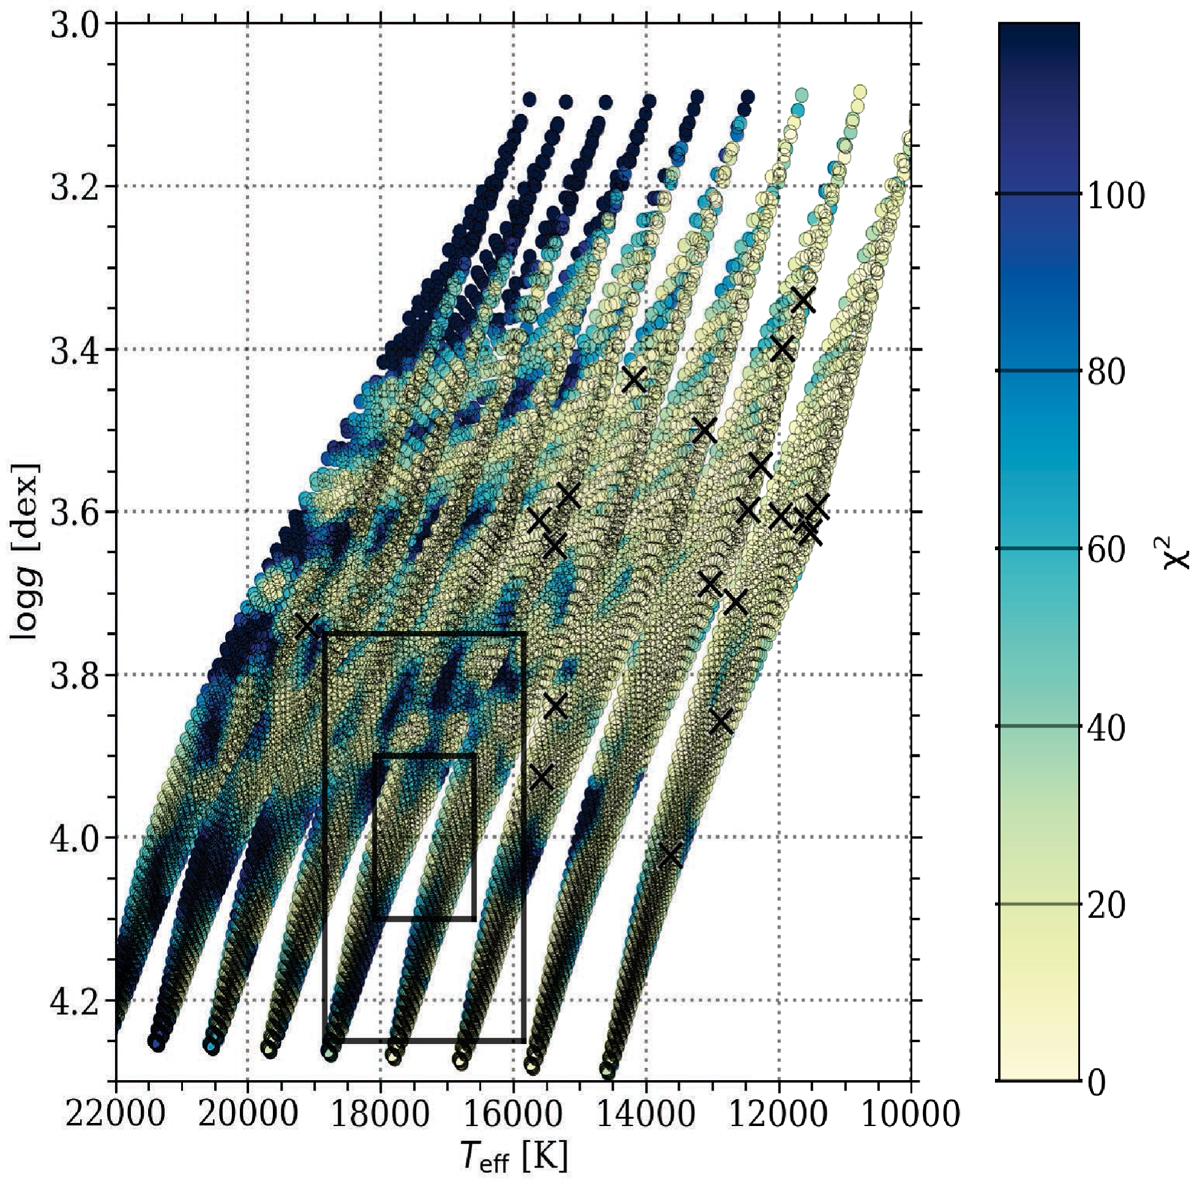
Kiel diagram showing the results of blind forward modeling based on all 28 pulsation mode frequencies. The colour scale indicates the χ2 level and the black crosses represent the location of the 20 best fitting MESA models. The 1σ and 2σ confidence intervals for the derived spectroscopic parameters by Pápics et al. (2012) are shown by the black boxes.
Current usage metrics show cumulative count of Article Views (full-text article views including HTML views, PDF and ePub downloads, according to the available data) and Abstracts Views on Vision4Press platform.
Data correspond to usage on the plateform after 2015. The current usage metrics is available 48-96 hours after online publication and is updated daily on week days.
Initial download of the metrics may take a while.