Fig. 1.
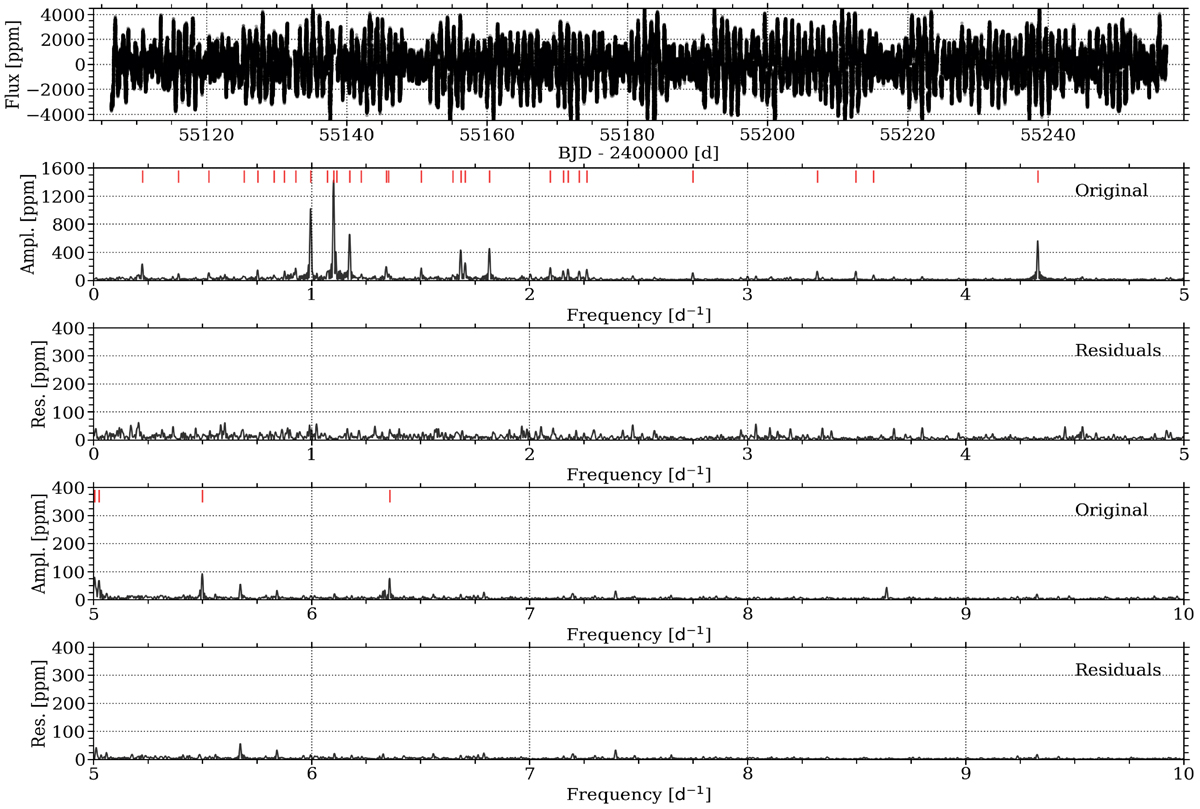
CoRoT light curve (top) and the corresponding Lomb-Scargle periodograms (2nd and 4th row for increased visibility) of HD 43317. The 35 significant frequencies are indicated by the red tick marks in the upper parts of the periodogram panels. Corresponding periodograms of the residual light curve are given in panels on the 3rd and 5th row.
Current usage metrics show cumulative count of Article Views (full-text article views including HTML views, PDF and ePub downloads, according to the available data) and Abstracts Views on Vision4Press platform.
Data correspond to usage on the plateform after 2015. The current usage metrics is available 48-96 hours after online publication and is updated daily on week days.
Initial download of the metrics may take a while.