Fig. 8.
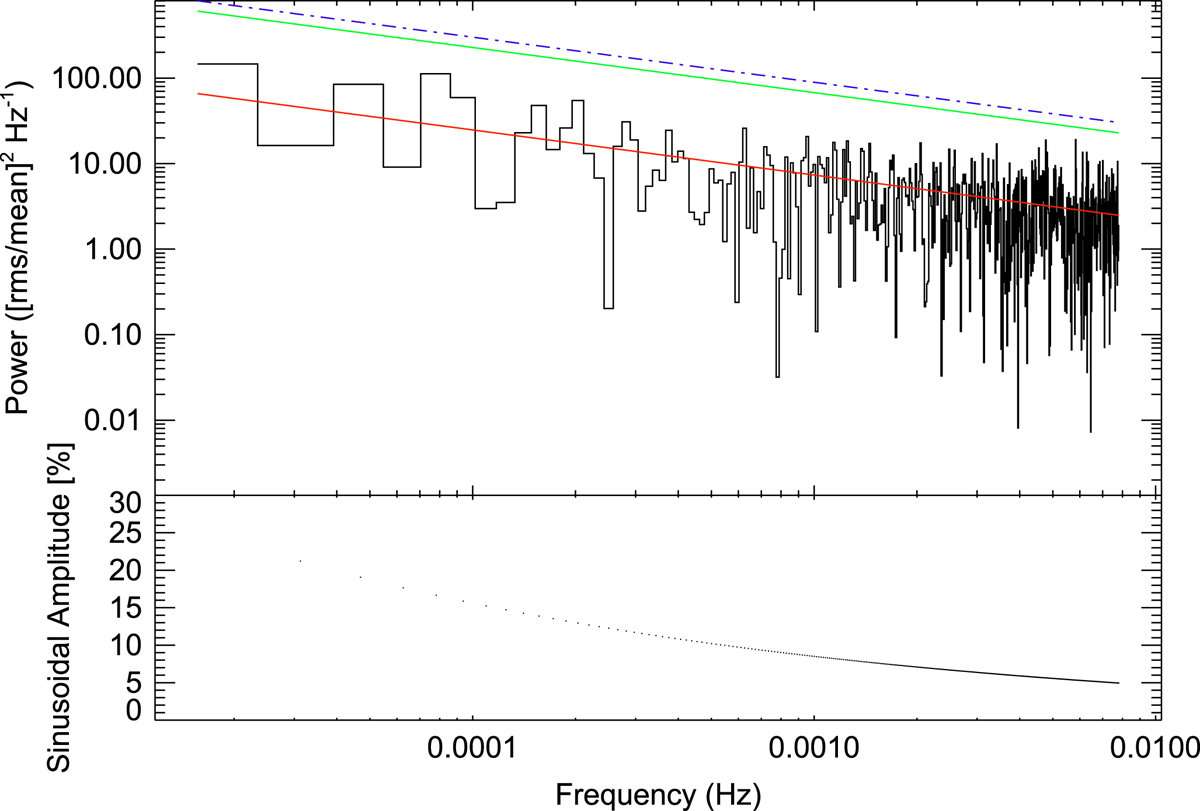
Top: NuSTAR power spectrum from an FPMA+FPMB light curve with bins of 64 s. The power law model for the red noise is shown in solid (red) line and the 95% (green) and 99.74% (blue) upper limits on the expected power are shown in dotted-dashed curves. Bottom: upper limit (3υ) on the sinusoidal fractional amplitude as a function of frequency.
Current usage metrics show cumulative count of Article Views (full-text article views including HTML views, PDF and ePub downloads, according to the available data) and Abstracts Views on Vision4Press platform.
Data correspond to usage on the plateform after 2015. The current usage metrics is available 48-96 hours after online publication and is updated daily on week days.
Initial download of the metrics may take a while.