Fig. 6.
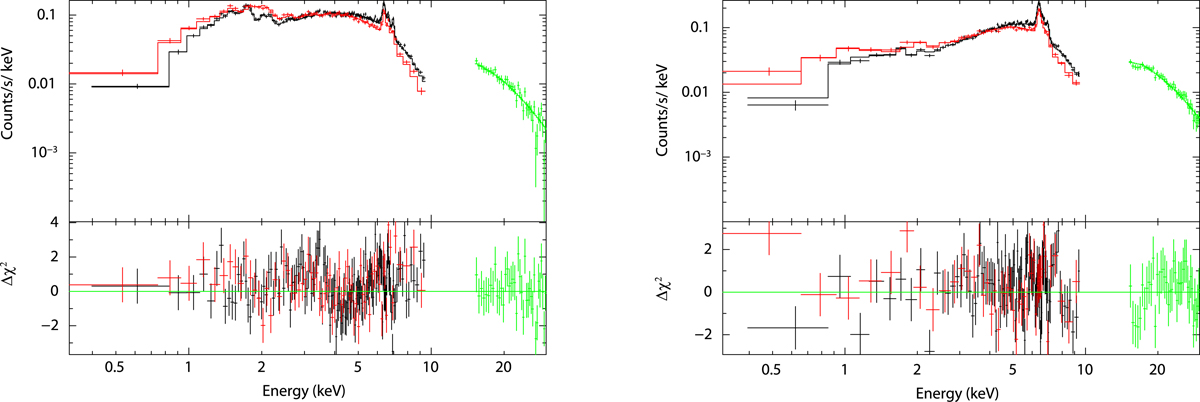
Left: Suzaku spectrum taken in 2007 (ObsID 402040010). Right: Suzaku spectrum taken in 2012 (ObsID 906007010). XIS0+3 spectra and model are shown in black, XIS1 in red and HXD in green. Best spectral model (solid line), consists of a variable abundance, isobaric cooling flow with fixed kTmax = 53 keV, modified by two complex, partial covering absorbers (see Table 1 for resulting parameters).
Current usage metrics show cumulative count of Article Views (full-text article views including HTML views, PDF and ePub downloads, according to the available data) and Abstracts Views on Vision4Press platform.
Data correspond to usage on the plateform after 2015. The current usage metrics is available 48-96 hours after online publication and is updated daily on week days.
Initial download of the metrics may take a while.