Fig. 4.
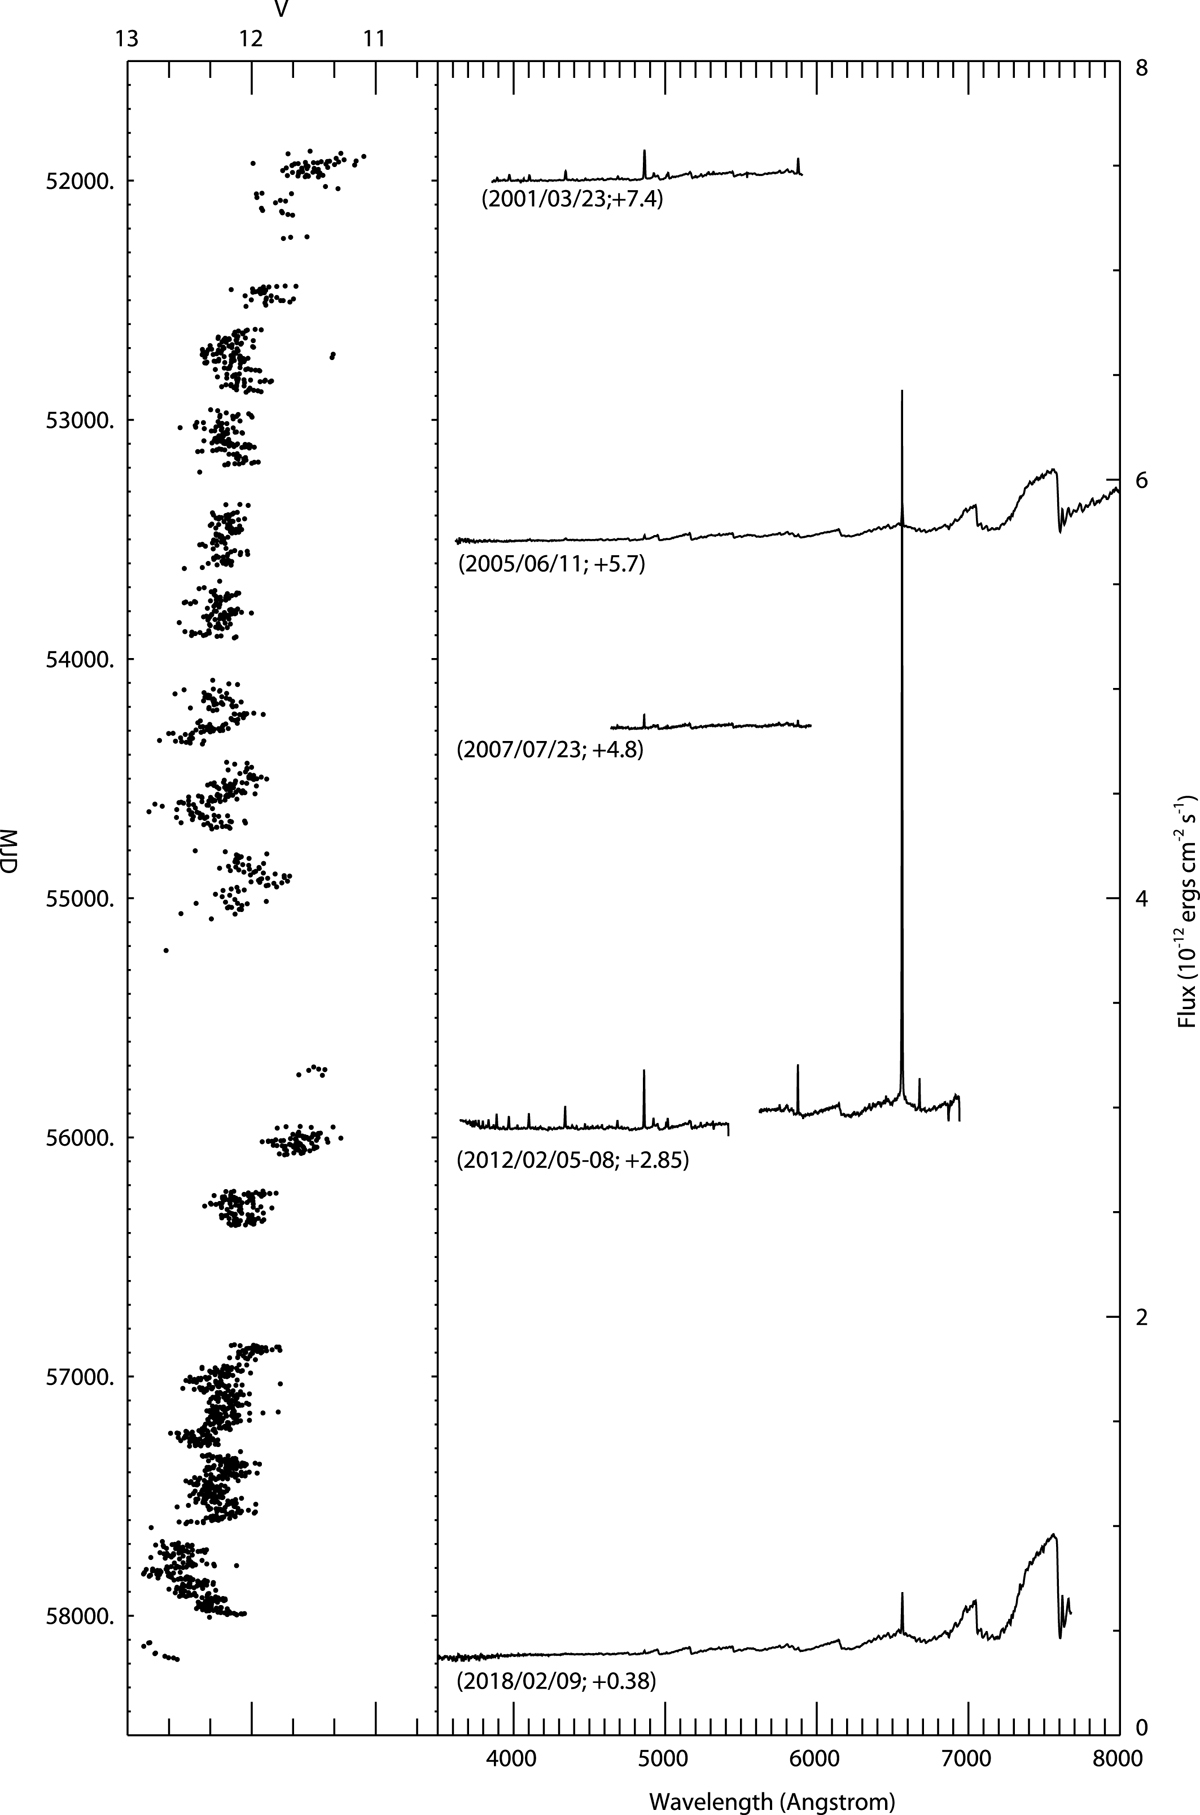
Comparison of optical spectra taken during faint and bright states. We indicate, in parentheses, the observation date and flux offset applied to match the observation date with the light curve in the left panel. During 2005 and 2018, well within the faint state, the red giant dominated the optical spectrum, and only a few emission lines (mostly Hα) were observed. On the other hand, in 2001 and 2012, during bright optical states, emission lines from highly ionized elements such as H, O, and Fe are strong.
Current usage metrics show cumulative count of Article Views (full-text article views including HTML views, PDF and ePub downloads, according to the available data) and Abstracts Views on Vision4Press platform.
Data correspond to usage on the plateform after 2015. The current usage metrics is available 48-96 hours after online publication and is updated daily on week days.
Initial download of the metrics may take a while.