Fig. 1.
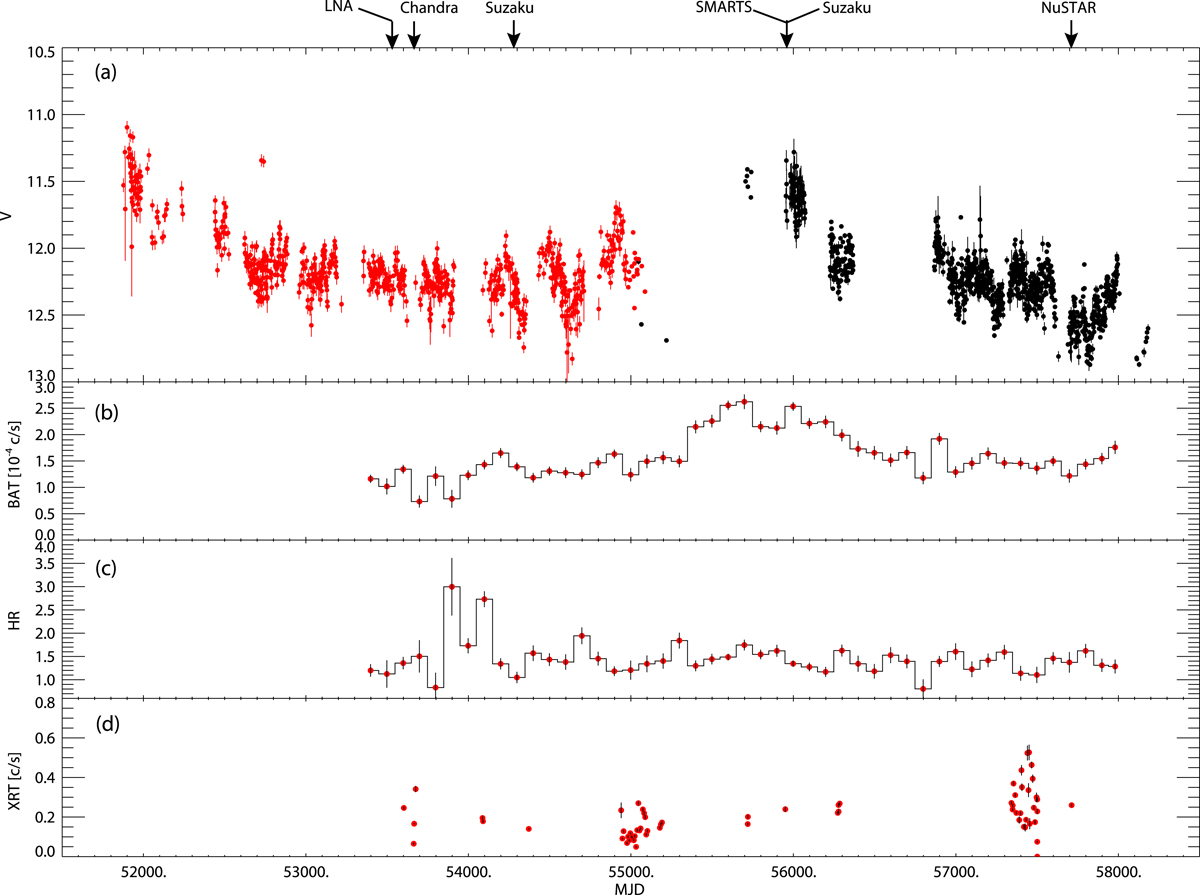
Panel a: AAVSO (black dots) and ASAS (red dots) V-magnitude light curve. Arrows mark the dates when RT Cru was observed with Chandra, Suzaku NuSTAR, LNA and SMARTS. Panel b: Swift BAT 153-months light curve with 100 days bin size in the energy range 15–85 keV; panel c: Swift/BAT Hardness ratio (15–25/25–45 keV); panel d: Swift/XRT light curve in the energy range 0.3–10 keV.
Current usage metrics show cumulative count of Article Views (full-text article views including HTML views, PDF and ePub downloads, according to the available data) and Abstracts Views on Vision4Press platform.
Data correspond to usage on the plateform after 2015. The current usage metrics is available 48-96 hours after online publication and is updated daily on week days.
Initial download of the metrics may take a while.