Fig. 4
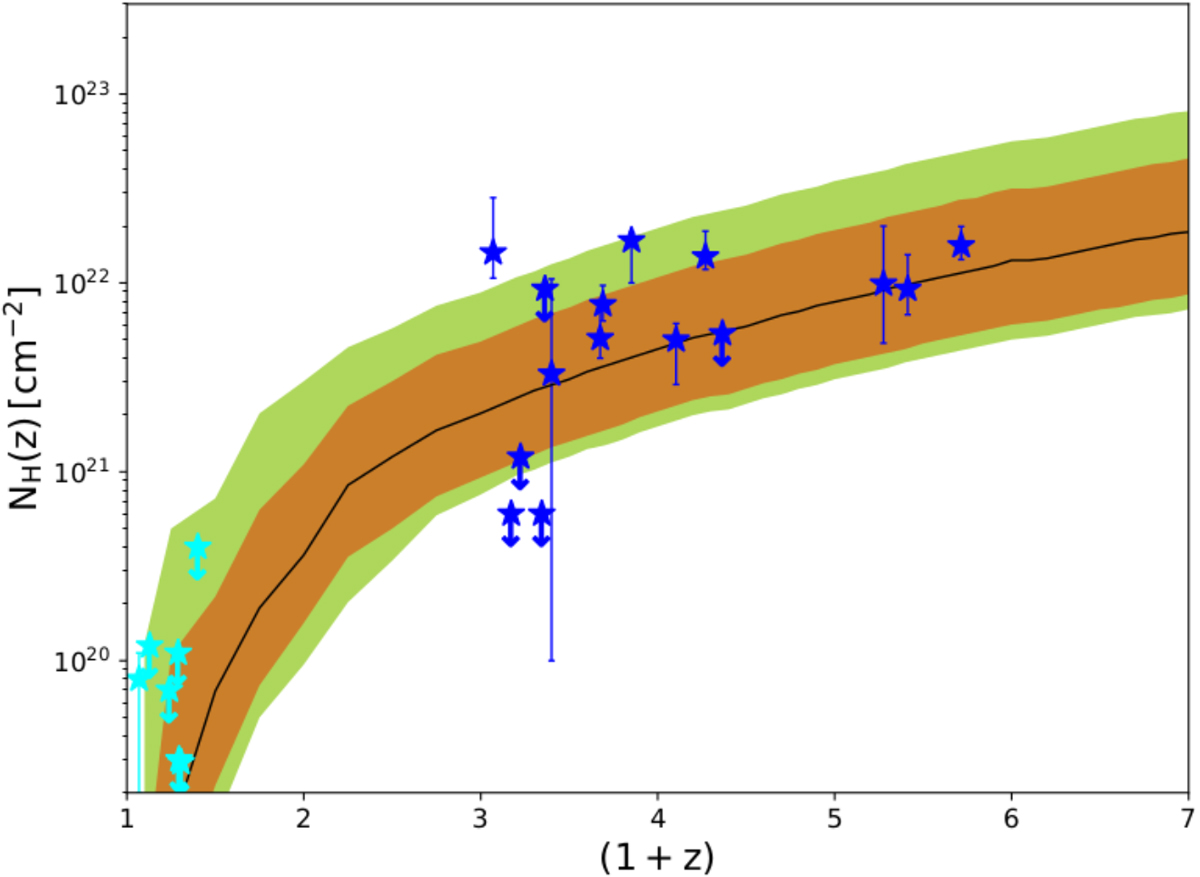
Distribution of NH(z) with redshift for blazars from this work. Blue objects belong to the Silver sample, while in cyan low-z data are shown. Error bars were computed within XSPEC at 90% confidence level (Δχ2 = 2.71), as were the upper limits (denoted with arrows). All curves and coloured areas were obtained from Campana et al. (2015): the solid line, along with its corresponding 1- and 2-sigma envelopes in brown and green, respectively, is the median of the absorbed LOS distribution, representing the mean absorption contribution from both a diffuse WHIM and additional intervening over-densities. We take the 2-sigma lower envelope as the minimum contribution from a diffuse WHIM alone.
Current usage metrics show cumulative count of Article Views (full-text article views including HTML views, PDF and ePub downloads, according to the available data) and Abstracts Views on Vision4Press platform.
Data correspond to usage on the plateform after 2015. The current usage metrics is available 48-96 hours after online publication and is updated daily on week days.
Initial download of the metrics may take a while.