Fig. 1.
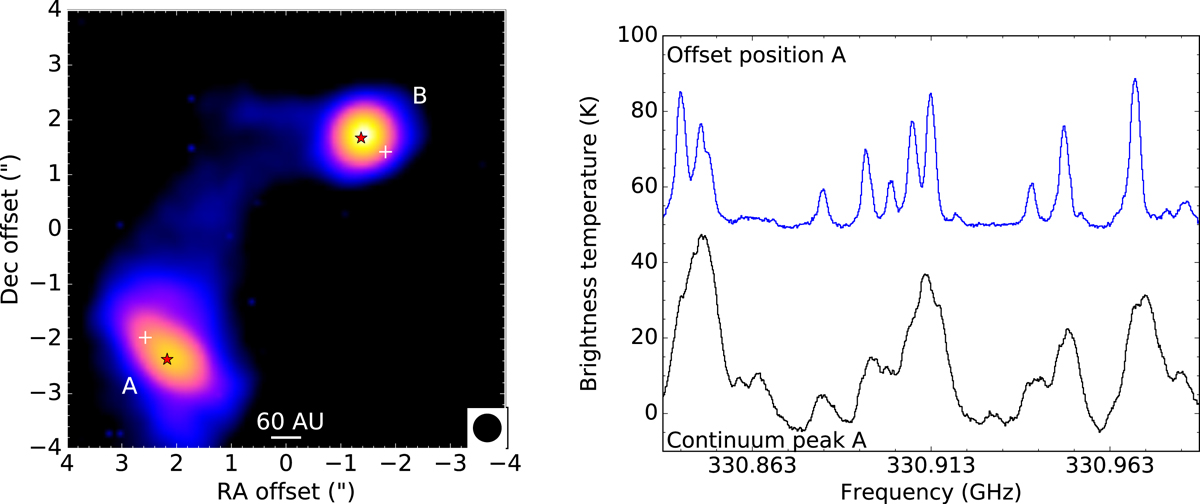
Left panel: band 7 (0.87 mm) continuum image of IRAS 16293 with the peak continuum positions marked with red stars and the offset positions analysed in this work marked with white crosses. Right panel: spectra towards the continuum peak position of source A (black line) and the offset position (blue line) analysed in this work.
Current usage metrics show cumulative count of Article Views (full-text article views including HTML views, PDF and ePub downloads, according to the available data) and Abstracts Views on Vision4Press platform.
Data correspond to usage on the plateform after 2015. The current usage metrics is available 48-96 hours after online publication and is updated daily on week days.
Initial download of the metrics may take a while.