| Issue |
A&A
Volume 616, August 2018
|
|
|---|---|---|
| Article Number | A64 | |
| Number of page(s) | 10 | |
| Section | The Sun | |
| DOI | https://doi.org/10.1051/0004-6361/201732159 | |
| Published online | 21 August 2018 | |
Solar radius determined from PICARD/SODISM observations and extremely weak wavelength dependence in the visible and the near-infrared
1
Université Paris Saclay, Sorbonne Université, UVSQ, CNRS, LATMOS, 11 Boulevard d’Alembert, 78280 Guyancourt, France
e-mail: This email address is being protected from spambots. You need JavaScript enabled to view it.
2
Université de la Côte d’Azur, Observatoire de la Côte d’Azur (OCA), CNRS, Boulevard de l’Observatoire, 06304 Nice, France
Received:
23
October
2017
Accepted:
9
May
2018
Abstract
Context. In 2015, the International Astronomical Union (IAU) passed Resolution B3, which defined a set of nominal conversion constants for stellar and planetary astronomy. Resolution B3 defined a new value of the nominal solar radius (R⊙N = 695 700 km km) that is different from the canonical value used until now (695 990 km). The nominal solar radius is consistent with helioseismic estimates. Recent results obtained from ground-based instruments, balloon flights, or space-based instruments highlight solar radius values that are significantly different. These results are related to the direct measurements of the photospheric solar radius, which are mainly based on the inflection point position methods. The discrepancy between the seismic radius and the photospheric solar radius can be explained by the difference between the height at disk center and the inflection point of the intensity profile on the solar limb. At 535.7 nm (photosphere), there may be a difference of ∼330 km between the two definitions of the solar radius.
Aims. The main objective of this work is to present new results of the solar radius in the near-ultraviolet, the visible, and the near-infrared from PICARD space-based and ground-based observations. Simulations show the strong influence of atmosphere effects (refraction and turbulence) on ground-based solar radius determinations and highlight the interest of space-based solar radius determinations, particularly during planet transits (Venus or Mercury), in order to obtain more realistic and accurate measurements.
Methods. Solar radius observations during the 2012 Venus transit have been made with the SOlar Diameter Imager and Surface Mapper (SODISM) telescope on board the PICARD spacecraft. We used the transit of Venus as an absolute calibration to determine the solar radius accurately at several wavelengths. Our results are based on the determination of the inflection point position of the solar limb-darkening function (the most common solar radius definition). A realistic uncertainty budget is provided for each solar radius obtained with the PICARD space-based telescope during the 2012 Venus transit. The uncertainty budget considers several sources of error (detection of the centers of Venus and Sun in PICARD images, positions of Sun and Venus from ephemeris (planetary theory), PICARD on-board timing, PICARD spacecraft position, and optical distortion correction from PICARD images).
Results. We obtain new values of the solar radius from the PICARD mission at several wavelengths and in different solar atmosphere regions. The PICARD spacecraft with its SODISM telescope was used to measure the radius of the Sun during the Venus transit in 2012. At 535.7 nm, the solar radius is equal to 696 134 ± 261 km (combined standard uncertainty based (ξ) on the uncertainty budget). At 607.1 nm, the solar radius is equal to 696 156 ± 145 km (ξ), and the standard deviation of the solar radius mean value is ±22 km. At 782.2 nm, the solar radius is equal to 696 192 ± 247 km (ξ). The PICARD space-based results as well as PICARD ground-based results show that the solar radius wavelength dependence in the visible and the near-infrared is extremely weak. The differences in inflection point position of the solar radius at 607.1 nm, 782.2 nm, and 1025.0 nm from a reference at 535.7 nm are less than 60 km for the different PICARD measurements.
Key words: Sun: general / Sun: fundamental parameters / telescopes
© ESO 2018
1. Introduction
The Sun is a star with a radius of  km (
km ( 959.63 arcsec) at one astronomical unit (1 au), which corresponds to the canonical value (Auwers 1891) that is commonly used. This value differs from the nominal solar radius value (
 km
km  arcsec) recommended by the XXIXth International Astronomical Union (IAU) General Assembly in 2015 (Prša et al. 2016). The IAU nominal value is based on one transit measurement (Solar Diameter Monitor, Brown et al. 1982) and two helioseismic determinations of the solar radius, in which the solar edge determined from helioseismic data is located below the photosphere. Since the solar radius has a new definition, a correction is required to compare the IAU value (
 ) and the direct measurements of the photospheric solar radius (
 ) that are mainly obtained through the inflection point position methods. The difference between the seismic solar radius and the inflection point position is
  ∼333 km (
 0.46 arcsec) for the apparent solar radius at 500 nm (Haberreiter et al. 2008). Brown & Christensen-Dalsgaard (1998) have corrected their observations to reduce their radius. Therefore, the direct measurements of the photospheric solar radius (
 ) have to be adjusted for comparison.
The absolute determination of the solar radius from direct measurements is a source of discussion even today. Recent results (Table 1) are not consistent and differ with the canonical value of the solar radius ( ). Authors can interpret the discrepancies in relation with the different methods of analysis used in their work. However, other effects may explain the discrepancies. Mainly, there is the influence of the atmosphere on ground-based measurements and the effects of the space environment on space-based measurements. Lunar and planetary transits of the Sun allow measurements of the solar radius with high accuracy. The determination of a realistic uncertainty budget remains a significant problem and requires special attention in its determination, such as in the analyses of Meftah et al. (2014b). Therefore, it is necessary to distinguish between the combined standard uncertainty of the individual random and systematic uncertainties (based on the uncertainty budget) and the standard error (standard deviation of the median value, or standard error on the fit that allows determining the solar radius). It is also necessary to specify the wavelength in relation to the solar radius measurements. Solar radius measurements at several wavelengths may be useful for testing numerical radiative hydrodynamics simulations of the solar atmosphere.
This work provides new values of the solar radius obtained during the PICARD mission for the space-based and the ground-based segments at several wavelengths. Solar radius observations during the 2012 transit of Venus have been made with the SOlar Diameter Imager and Surface Mapper (SODISM) telescope on board the PICARD spacecraft (Meftah et al. 2014c). In addition, PICARD SOL is the ground-based segment of PICARD (Meftah et al. 2014a), which allows comparison of the solar radius measured in space to those obtained on ground by the PICARD/SODISM II instrument at the Observatoire de la Côte d’Azur (Calern site). One of the PICARD objectives was to determine the absolute values of the solar radius at several wavelengths at 393.37, 535.7, 607.1, 782.2, and 1025.0 nm. The last four wavelengths were selected for their desired shortage of Fraunhofer absorption lines, while the 393.37 nm wavelength reflects the chromosphere and activity therein.
PICARD contains a double program with in-space (PICARD spacecraft) and on-ground measurements (PICARD SOL). It aims at perpetuating valuable historical time-series of the solar radius. Space-based observations are a priori more favorable than ground-based observations. However, space-based measurements present technical challenges such as stability of the point spread function (PSF) of the instrument, a harsh operating environment, and a finite mission lifetime. As a reminder, the PICARD spacecraft was launched in June 15, 2010, and was retired in April 2014. On the ground, the instruments are less strongly affected by degradation than in space since maintenance is easy to provide. In addition, if the atmosphere is properly monitored and taken into account, they still represent an opportunity for generating long-term time-series. Ground-based measurements have therefore been carried out by the PICARD/SODISM II instrument beginning in May 2011 and continuing through 2018.
Section 2 provides the most common solar radius definition used in most analyses. Section 3 discusses the influence of the atmosphere on ground-based solar radius measurements. Section 4 shows the results obtained with the PICARD/SODISM II ground-based instrument after making all necessary corrections (angular calibration with stars, Sun distance, refraction, estimation of the turbulence, etc.). The difficulty of ground-based measurements highlights the interest of measurements outside the atmosphere with space-based instruments. Section 5 shows the results obtained with the PICARD/SODISM space-based telescope using the June 2012 transit of Venus (see the image acquired by the SODISM instrument at the end of the transit in Appendix A).
Recent results of the solar radius at 1 au using different methods and instruments for different wavelength ( ).
).
2. Definition of the solar radius
The results may be influenced by the definition of the solar radius that is used. The most common solar radius definition is based on the determination of the inflection point position of the solar limb-darkening function (LDF). As explained by Emilio et al. (2015), the absolute value of the solar radius determined by Hauchecorne et al. (2014) cannot be compared with the inflection point position method since the authors adopted a different definition of the solar radius that does not depend on the inflection point position of the LDF. The method of Hauchecorne et al. (2014) is based on the spectral solar radiance decrease estimation in an area around the contact between Venus and the Sun during ingress and egress. Despite this, the SODISM solar radius at 607.1 nm reported by Meftah et al. (2014b) and by Hauchecorne et al. (2014) with two different methods are very similar, 696 156 145 km (959.86
 0.20 arcsec) with the inflection point position of the LDF definition and 696 149
 138 km (959.85
 0.19 arcsec) with the spectral solar radiance decrease estimation method. On the other hand, the solar radius obtained during the 2012 transit of Venus by the Helioseismic and Magnetic Imager (HMI) is equal to 695 946 km (959.57 arcsec; Emilio et al. 2015) using the common definition of the solar radius and is equal to 696 185 km (959.90 arcsec) using the Hauchecorne et al. (2014) method. Use of different definitions of the solar radius can lead to significantly different results. We here focus only on PICARD results obtained from the common definition of the solar radius (inflection point position of the LDF definition).
For a given solar atmosphere, the solar radius depends on wavelength. The solar atmosphere is primarily composed of the photosphere, the chromosphere, and the corona. The photosphere is the lowest layer of the solar atmosphere. It is about 500 km thick, providing more than 90 of the solar emitted radiation (especially in the visible). The height scale of the photosphere is not arbitrary. The base of the photosphere (height of 0 km) is defined as the optical depth of one (i.e.,
  = 1). For a given spectral domain, solar atmospheric models allow calculating the solar limb shape and determining the inflection point position with or without Fraunhofer lines. From radiative transfer simulations, we can accept variations of
  18 km (
 25 mas) between measurements made at several wavelengths in the photospheric continuum (Meftah et al. 2014a).
PICARD measurements (space-based and ground-based segments) in the solar photospheric continuum (535.7 nm, 607.1 nm, 782.2 nm, and 1025.0 nm) correspond to observations of the photosphere (at a height of between 300 and 400 km measured from the solar limb level). PICARD also enables observing the chromosphere (393.37 nm), which is an irregular layer of approximately 1500 km thickness. The chromosphere extends from 500 to 2000 km above the photosphere. One of its most prominent spectral line is the Ca II K line, which is split into three regions. Each region shows a specific area of the chromosphere. The formation heights according to Vernazza et al. (1981) are 450–650 km (at 0.15 nm from the core, K1), 700–1450 km (K2), and 1800–2000 km (core at 393.37 nm in air, K3), where prominences are visible, for instance. The Ca II K line is very sensitive to magnetic activity. However, this line is very wide and complex, showing a profile both in absorption and in emission. It originates in different heights of the chromosphere. The emissive part of this line reflects the temperature of the matter, creating brilliant regions that are called plages or faculae and are mainly situated around sunspots. PICARD Ca II K filters have a wide bandwidth ( ) of 0.7 nm over the core at 393.37 nm, which covers the entire K1, K2, and K3 regions. Thus, PICARD Ca II K imagery reveals magnetic structures of the Sun from about 450 to 2000 km above the photosphere. Through PICARD observations, we can determine the absolute value of the photospheric and specific “chromospheric” solar radius. Knowledge of the solar radius and its wavelength dependence is of interest for solar physics. These explanations show that it is necessary to evaluate the solar radius wavelength dependence in different wavelength intervals, separating the measurements between the different solar regions: photospheric continuum, and chromosphere (Ca II K observations made by the PICARD team, H-
 observations, etc.).
3. Influence of the atmosphere on ground-based solar radius measurements
The accurate determination of the solar radius is strongly influenced by the effects of the atmosphere (refraction and turbulence), particularly for imaging telescopes such as PICARD SOL/SODISM II. Space-based measurements therefore have a high interest in countering atmospheric effects.
3.1. Influence of atmospheric refraction
Simulations of atmospheric effects on solar radius measurements show the influence of atmospheric refraction. Refraction is the deviation of light from a straight line as it passes through the atmosphere due to the variation in air density as a function of height. The key inputs for atmospheric refraction correction are temperature ( ), pressure (
 ), and relative humidity (
 ). The solar radius after refraction correction is obtained by
![Mathematical equation: $$\begin{array}{lllllllllllllll}{{R_ \odot } \simeq \frac{{{R_{\rm{o}}}}}{{1 - {k^\prime } - \frac{1}{2}{k^\prime }{{\tan }^2}(z_ \odot ^t)}},}\\{{k^\prime } = \alpha (1 - \beta )\left[ {1 - \alpha (1 - \beta ){{\sec }^2}({z^t})} \right]}\end{array}$$](/articles/aa/full_html/2018/08/aa32159-17/aa32159-17-eq52.gif) (1)
(1)
where  represents the mean observed solar radius,
  is the true zenith angle (from the ephemeris), and
  is the true topocentric zenith angle. The effect of atmospheric refraction is that it changes the true topocentric zenith angle of the Sun to a lower observed angle.
  (Eq. (2)) is the air refractivity (Ciddor 1996) for local atmospheric conditions at a given wavelength (
 ), where n is the refractive index of air.
  (Eq. (3)) is the ratio between the height (l) of the equivalent homogeneous atmosphere and the Earth radius of curvature (
 ) at the observer position, assuming an ideal gas law for dry air. For the Calern site,
  is close to
  m.
m.  is the air density, g is the gravity acceleration, and
  represents a constant equal to 29.255 m K
 (ideal gas law),
 (2)
(2)
 (3)
(3)
From Eq. (1) we can determine the influence of atmospheric refraction on solar radius measurements as a function of the zenith angle. For this analysis, we took standard conditions of the atmosphere ( C,
C,  hPa, and
  ). Figure 1 represents the influence of refraction on SODISM II solar radius measurements as a function of the zenith angle. Refraction is much stronger when the Sun is near the horizon than when it is near the zenith. The difference between the mean radius of the observed Sun and the true solar radius is always negative. This simulation highlights the importance of this correction and shows that ground-based measurements (
 ) will always have smaller observed than true solar radii (
 ).
).
We applied the refraction correction on the mean observed solar radius ( ). The correction uncertainty is smaller than 20 mas for zenith distances smaller than 70
 . For more accurate measurements, the corrections can be applied individually for each heliographic angle of the solar disk.
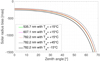 |
Fig. 1. Impact of refraction on the measurements of the solar radius for several wavelengths. Solar radius bias ( |


3.2. Influence of atmospheric turbulence
Measurements of the solar radius made with ground-based instruments are affected by the atmosphere, and particularly by atmospheric turbulence (Roddier 1981). The wavefront of light propagating through the Earth atmosphere is randomly perturbed by turbulence. Simulations of atmospheric effects on solar radius measurements show the influence of seeing conditions. There are three common descriptions of the astronomical seeing conditions at an observatory:
-
The FWHM of the seeing disk (or just “seeing”). A 1 arcsec seeing is good for astronomical sites.
-
The Fried (1965) parameter (
 ) and the timescale (
 ). The Fried parameter is the diameter of the coherence area of the degraded wavefront. It also corresponds to the diameter of an equivalent telescope whose spatial resolution results from turbulence effects (Roddier 1981). For the Calern site, the median Fried parameter is on the order of 3.3 cm at 535.7 nm (Ikhlef et al. 2016) in one year of observations. Irbah et al. (2016) highlighted lower
  values for few days of observations with a non-optimized instrument.
  is the timescale over which the changes in the turbulence become significant.
 -
The turbulence profile as a function of altitude (
 ).
).
-
The outer scale vertical profile (
 ), which is the distribution of the characteristic scale of the largest velocity inhomogeneities in turbulent layers.
 -
The spatial coherence outer scale (
 ), which defines the maximum size of wavefront perturbations that remain coherent. For the Calern site, the outer scale median value is
  6.3 m (Ikhlef et al. 2016).
 -
The isoplanatic patch (
 ), which represents the angle where phase or speckles remain correlated.
 ,
,  ,
,  ,
,  , and
, and  ). This work is still in progress (Irbah et al. 2010; Ikhlef et al. 2016) to obtain not only daily and monthly averages, but continuous estimates of these parameters.
We developed a simple model, as shown in Appendix B, to highlight the strong influence of atmospheric turbulence on the determination of the solar radius with ground-based telescopes. This approach demonstrates that the main source of uncertainty and bias for all ground-based astrometry programs is the effect of atmospheric turbulence.
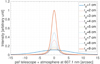 |
Fig. 2. Impulse response of the instrument–atmosphere system at 607.1 nm for several values of the Fried parameter ( |


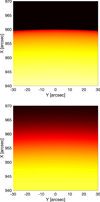 |
Fig. 3.
Top: image of the Sun made using the instrument–atmosphere system at 607.1 nm with |


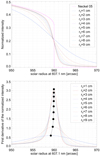 |
Fig. 4.
Top: solar limb-darkening functions (LDF |


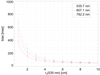 |
Fig. 5. Impact of the atmospheric turbulence on the solar radius determination (535.7, 607.1, and 782.2 nm) for a perfect instrument (theoretical PSF). Solar radius bias ( |


3.2.1. Impact of the atmospheric turbulence on solar radius
At the Calern site, the Fried parameter can vary between 1 cm and up to 6 cm during SODISM II images acquisitions. Figure 2 shows the impulse responses of the instrument–atmosphere system for different values of the Fried parameter. The atmospheric turbulence causes a spread and blur of the solar limb when 
 1 cm (Fig. 3). This causes a displacement of the position of the inflection point of the limb-darkening function (Fig. 4). For this analysis, we can use the model of the solar limb-darkening function (HM98) developed by Hestroffer & Magnan (1998) or the Neckel 2005 model (Neckel 2005), which represents the physical solar limb better. Figure 5 shows the impact of the atmospheric turbulence on the solar radius determination at several wavelengths.
3.2.2. Conclusions
The main problem is estimating the optical transfer function (OTF), which describes atmospheric turbulence effects on recorded images. Several procedures have been developed a posteriori on observations to calculate the instrument–atmosphere system PSF. This simulation highlights the importance of the turbulence correction and shows that ground-based measurements will always have smaller solar observed radii. For telescopes with diameters ( ) larger than
  , the image resolution is determined primarily by the atmosphere. The accurate determination of the solar radius from ground-based data is not obvious and may introduce significant uncertainties in final results.
4. Solar radius determined from PICARD/SODISM II ground-based measurements
The SODISM II solar radius results (photospheric continuum and “chromospheric”), corrected as described in Meftah et al. (2014a), are listed in Table 2.
At the end of life of the PICARD SOL mission, a laboratory characterization of the SODISM 2 instrument (PSF and plate scale) will be carried out in order to refine the results. A test bench with a xenon lamp and a collimator will be used to create an artificial image of the Sun. An optical distortion target (pinholes) will be placed between the collimator and the lamp to characterize the telescope. Moreover, the MISOLFA data analysis will be improved ( ,
,  , etc.).
4.1. Solar radius wavelength dependence
The PICARD SOL solar radius at 393.37 nm (Fig. 6) is largely higher than the curve fitting proposed by Rozelot et al. (2015). This result shows that it is interesting to evaluate the solar radius wavelength dependence by properly taking into account different solar regions before fitting polynomial functions to the measurements.
The SODISM II solar radius dependence on the wavelength in the visible and the near-infrared is extremely weak, as shown in Fig. 6. The poor agreement with the curve fitting proposed by Rozelot et al. (2015) is evident. Moreover, Rozelot et al. (2015) investigated the solar radius wavelength dependence in different wavelength intervals by fitting polynomial functions to the measurements in the near-ultraviolet, the near-infrared, and the visible from different ground-based instruments. In their analysis, they considered the SODISM II solar radius obtained at 535.7 and 607.1 nm, but did not take into account the solar radius obtained at 782.2 and 1025.0 nm, although it was published in Meftah et al. (2014a). The inclusion of these results significantly changes their conclusions. The differences of the inflection point position ( IPP) at 607.1 nm, 782.2 nm, and 1025.0 nm from the inflection point position reference at 535.7 nm are indeed smaller than 100 mas for the different SODISM II measurements. Moreover, Meftah et al. (2014a) analyzed the impact of an instrumental effect (optical aberration) on the inflection point position. They demonstrated that the
  IPP differences are dominated by a poor correction of the wavelength dependence of instrumental (plate-scale, PSF) and atmospheric effects and not by the weak wavelength dependence of the solar LDF itself in the photospheric continuum. Therefore, the solar radius wavelength dependence in the visible and the near-infrared is extremely weak, and still lies within the 100–200 mas combined observational uncertainties.
Summary of the PICARD solar radius observations at several wavelengths.
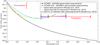 |
Fig. 6. Solar radius variation with wavelength from PICARD SOL ground-based data (SODISM II data in red) and from PICARD spacecraft data (SODISM data in blue). The “chromospheric point” corresponds to the “PICARD” Ca II K line band. We also plot the solar radius variations with wavelength from data polynomial fits (Rozelot et al. 2015) |
4.2. Discussion of the combined standard uncertainty (uncertainty budget) and standard error (standard deviation of the solar radius median value)
Rozelot et al. (2015) summarized the solar radius observations at several wavelengths and provided errors on the determination of the solar radius for each experiment, although they are not of the same nature. For the PICARD case, the “error” on the solar radius determination corresponds to a combined standard uncertainty of the individual standard uncertainties ( ) and not to a standard deviation of the solar radius median value (STD). The error is the difference between the measured value and the “true” value of the variable being measured, and the uncertainty is a quantification of the doubt about the measurement result. PICARD results are associated with an uncertainty budget with random (when repeating the measurement gives a randomly different result) and systematic (when the same influence affects the result for each of the repeated measurements) uncertainty sources.
5. Solar radius determined from PICARD/SODISM space-based measurements
The effects of the space environment (ultraviolet (UV), polymerization, contamination, radiation, South Atlantic Anomaly, thermal cycling, etc.) lead to considerable degradation of the instruments in orbit, such as PICARD/SODISM (Meftah et al. 2014c), which directly observed the Sun from July 2010 to March 2014. All these effects require complex corrections (optical, thermal, and electrical). The best way is to determine the solar radius during a planetary transit to counter calibration errors and aging in space due to the effects of the space environment. We therefore used the transit of Venus as an absolute calibration to determine the solar radius accurately at several wavelengths.
5.1. Method implemented for PICARD/SODISM data
This section describes the method used to determine the solar radius accurately at several wavelengths from PICARD/SODISM observations. The 2012 transit of Venus is used to provide an absolute plate scale to calibrate the solar inflection point position. Our results are based on the determination of the inflection point position of the solar limb-darkening function. The true solar radius ( ) at a given wavelength is obtained from determining several parameters: the plate scale of the telescope (PS
 in arcsec per pixel), the optical distortion function of the telescope (
 without units) and the mean solar radius of the normalized image at one astronomical unit (
 in pixels). The direct measurements of the photospheric solar radius (
 ) are obtained from Eq. (4). For each image acquired during the 2012 transit of Venus, the mean solar radius at a given wavelength is determined by
 (4)
(4)
The plate scale of the telescope is obtained from the determination of the positions of the Sun and Venus from ephemeris and PICARD/SODISM images (Eq. (5)). It is necessary to know the ephemeris and to calculate the positions of the Sun and Venus from images taken by the SODISM instrument. The transit of Venus is a very convenient tool for calibrating the SODISM telescope (PSF and plate scale), (5)
(5)
where  corresponds to the distance between the Sun and Venus obtained from the ephemeris (arcsec),
  and
and  correspond to the Sun positions obtained from PICARD images (pixels), and
  and
and  correspond to the Venus positions obtained from PICARD images (pixels).
The optical distortion function was obtained during a PICARD/SODISM calibration (determination of the telescope distortion during spacecraft rotation using a total of 1040 images at a given wavelength). During distortion measurements campaigns, the PICARD spacecraft revolves around the PICARD-Sun axis by steps of 30 from North to West (clockwise). Solar images are taken for each roll step of the spacecraft (80 images per roll step). The optical distortion function is obtained by
 (6)
(6)
where  (in pixels) represents the value of the mean solar radius obtained during the distortion campaign and
  corresponds to the radius value (in pixels) at the desired angular position (
 ). The optical distortion function is obtained from many images acquired at several angular positions of the spacecraft. Thus, the random-type error associated with its determination is very weak (a few mas).
5.1.1. Determination of the positions of the Sun and Venus from ephemeris
The ephemeris calculation requires knowledge of the spacecraft positions, the Venus positions, and the Sun positions in the J2000 coordinate system. The PICARD spacecraft coordinates were corrected for precession (Capitaine et al. 2003), nutation (Seidelmann 1992), and aberration due to the speed of the spacecraft. The uncertainty obtained is 0.1 mas. Planetary theories (Fienga et al. 2008) were used to determine the positions of Venus and the Sun. The uncertainty obtained is 5 mas. These uncertainties can be considered negligible compared to the uncertainty associated with the PICARD on-board timing (80 mas), which could be significantly reduced (work in progress). For each PICARD date of image, the distance between the center of the Sun and the center of Venus was calculated using the ephemeris ( in arcsec).
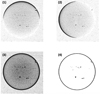 |
Fig. 7. Panel 1: PICARD/SODISM image (607.1 nm) acquired on June 6, 2012 at 04H31 UTC with a horizontal gradient. Panel 2: vertical gradient. Panel 3: norm of the gradient. Panel 4: norm of the gradient with the use of a threshold. |
5.1.2. Determination of the positions of the Sun and Venus from PICARD/SODISM images
The main uncertainty depends on the determination of the position of the Sun and Venus (up to a few tenths of a pixel). These positions were determined for each image taken by the SODISM instrument. The distance between the center of the Sun and the center of Venus was calculated ( in pixels).
This section describes the method used to obtain the parameters used in the determination of the plate scale (radius and location of the center of the Sun and Venus). Six steps are necessary:
-
Noise removal. The image is processed with a median filter to remove outlier pixels. Then, a Gaussian blur is applied to smooth the edges in the image. The displacement of Venus across the solar disk generates a slight blur.
-
Extraction of contours. The contours are extracted using the Sobel filter (operator used in image processing for the detection of gradients) and the Canny method (a tool that allows good contour detection and good localization). A threshold applied to the norm of the gradient is used to select the pixels of the contours. An example of gradient extraction on one image is shown in Fig. 7 using the image of the Sun acquired by the PICARD/SODISM instrument at 607.1 nm in June 2012.
-
Center detection using the Hough method. The Hough method (Hough 1962; Duda & Hart 1972) is used in image segmentation; this method is not very sensitive to noise and allows detecting geometrical shapes for a given image. This method is used to detect the centers of the Sun and Venus. This is a good approximation to detect the centers in order to start the extraction of each inflection point position of the contours.
-
Extraction of the inflection point position. The next step is to extract a set of edge points from the contour of the Sun and Venus. This is done by analyzing the profile whose abscissa is a range of radii and whose ordinates are the intensity levels interpolated along radial segments. The edge of the contour is determined by the abscissa for which the above profile reaches the highest gradient. This abscissa can be computed with three methods: an analysis of the numerical first derivative, an adjustment of the profile by a polynomial function, and an adjustment of the profile by a rational function. We employed the first method.
-
Characterization of the ellipse. After the edge points are computed, the set of points is fitted by a circle, a non-oriented ellipse, or an oriented ellipse. The ellipse center is computed and the edge points are extracted again using the new center to extract a new set of profiles. This new set of profiles is used to compute a new ellipse whose center is used to extract another new set of profiles, and so on until the distance between two consecutive centers is lower than the value (in pixels) of a stop criterion. This refinement should converge to a best characterization of the ellipse because the radial segments are becoming more and more perpendicular to the tangents to the ellipse contours, and the edges consequently become ever more accurate (the gradients are increasingly higher) in the profile curves.
-
Average radius of the Sun and Venus. The apparent radii of the Sun and Venus are determined from the position of the different points of the contours (median value).
5.2. Results
The PICARD/SODISM solar radius results (photospheric continuum at 535.7, 607.1, and 782.2 nm), using the method described in Sect. 5.1, are listed in Table 2. At 215.00 and 393.37 nm, we have no results because the SODISM images are blurred and no distortion correction is available around the period time of the transit of Venus in 2012. A realistic uncertainty budget (Table 3) is provided for each solar radius obtained with the SODISM space-based telescope during the 2012 Venus transit. The uncertainty budget considers several sources of errors (detection of Venus and Sun centers from PICARD images, Sun and Venus positions from ephemeris (planetary theory), PICARD on-board timing, PICARD spacecraft position, and optical distortion correction from images). For each result, we calculated the combined standard uncertainty of the individual standard uncertainties (based on the uncertainty budget) and the standard error (standard deviation of the median value).
The value of the solar radius at 607.1 nm is equal to  arcsec (
 ). This result corresponds to the most accurate value obtained with the PICARD/SODISM data (higher number of measurements, measurements during contacts, and the best PSF). The standard deviation of the median value is
  0.06 arcsec (STD). The combined standard uncertainty (
 ) takes into account the different types of errors (random and systematic). From the method developed in Sect. 5.1, we calculate the solar radius at 535.7 nm and at 782 nm. For each image at a given wavelength (535.7 and 782.2 nm) during the June 2012 transit of Venus, we determined the mean value of the solar radius and its center in this way. From the knowledge of the plate scale (arcsec pixel
 ), we can calculate the value of the solar radius (arcsec) at 1 au (Fig. 8, curves plotted with black squares). The new values obtained at 535.7 and 782.2 nm can be corrected for the optical distortion function of the telescope (
 ). The plate scale depends on its position from the center to the limb (distance r in mm on the charge-coupled device (CCD)). The Ritchey-Chrétien configuration of the SODISM telescope minimizes spherical and coma aberrations, but this design presents some field curvature. Moreover, since the image quality was primarily required at the solar limb, the CCD was consequently positioned to reach its best focus there, that is, about 16 arcmin away from the field-of-view center. Figure 8 shows the corrected measurements (distortion correction) at each wavelength (535.7, 607.1, and 782.2 nm) near the solar limb when r is between 8.5 to 11.5 mm. At 535.7 nm, the solar radius is equal to 959.83
  0.36 arcsec (
 ), that is, consistent with the results obtained at 607.1 nm. The standard deviation of the solar radius median value (standard error) is
  0.15 arcsec because we only have few images near the solar limb. Similarly, at 782.2 nm, the solar radius is equal to 959.91
  0.34 arcsec (
 ). The standard deviation is
  0.19 arcsec (few images).
Therefore, the SODISM solar radius as a function of wavelength in the visible (535.7 nm and 607.1 nm) and the near-infrared (782.2 nm) is extremely weak, as shown in Fig. 6. The PICARD photospheric solar radius depending on the wavelength is almost constant, in contrast to the claim made in Rozelot et al. (2015). Our results using the Venus transit as an absolute calibration clearly show the dependence of the solar radius on wavelength, which raised many questions.
Error budget in the determination of the PICARD/SODISM solar radius (typical values in mas) with error types (random (R) or systematic (S)).
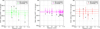 |
Fig. 8. Solar radius measurements (535.7, 607.1, and 782.2 nm) obtained from PICARD/SODISM measurements during the Venus transit. The solar radius at 1 au (no distortion correction) is plotted with black squares, and the solar radius at 1 au (with distortion correction) is plotted with circles. r represents the distance from the center of the Sun image on the SODISM CCD to the solar limb ( |

6. Conclusions
One of the best methods to determine the solar radius accurately is to measure it during planet transits (Venus or Mercury). The planet transits can even be used as an absolute calibration to determine the solar radius accurately. This allows countering calibration errors, effects of the atmosphere for ground-based instruments, and aging in space for space-based instruments.
From the PICARD mission, we obtained the solar radius at several wavelengths and from different solar atmosphere regions. PICARD data show that the solar radius wavelength dependence in the visible and the near-infrared is extremely weak. The differences of the inflection point position of the solar radius at 607.1 nm, 782.2 nm, and 1025.0 nm from a reference at 535.7 nm are smaller than 100 mas for the different PICARD measurements. The photospheric solar radius dependence on the wavelength is extremely weak, in contrast to claim made in Rozelot et al. (2015), and this is even expected since the density profile of the Sun near the photosphere is very sharp.
Rozelot et al. (2015) claimed that the solar radius wavelength dependence were clear. From X-ray to radio waves, they analyzed the solar radius dependence on wavelength using data sets that are associated with scientific publications. For measurements in the visible and the near-infrared, their analysis requires an improvement. Our work sheds new light on the solar radius wavelength dependence. The PICARD data showed that the solar radius wavelength dependence in the visible and the near-infrared is extremely weak. Moreover, it is necessary to distinguish the wavelength dependencies of the solar radius based on two different regions of the solar atmosphere (photosphere and chromosphere). It is known that the Ca II K line (the K3 region lies at 393.37 nm) originates in the lower part of the chromosphere and the H line (core at 656.28 nm) in the middle chromosphere. The H
 core region (1500 km above the photosphere) is lower than the K3 region (1800 km). Thus, when evaluating the solar radius wavelength dependence in different wavelength intervals, one needs to consider these differences before fitting any polynomial functions to the measurements. The PICARD/SODISM II solar radius at 393.37 nm (
 nm) is
  1500 km above the base of the photosphere.
Correcting the PICARD/SODISM solar radius value (at 535.7 nm) of  261 km (959.83
  0.36 arcsec) by
  333 km (
 0.46 arcsec) for the apparent solar radius at 500 nm, our corrected results (
 261 km; 959.37
  0.36 arcsec) from the space-based instrument are fully consistent with the nominal solar radius adopted by the IAU (
 km (959.23 arcsec) with respect to
  ). These results confirm the reconciliation between the inflection point measurements and the seismic radii within the combined uncertainties (
 ), as demonstrated in this analysis.
Our most reliable and accurate result is obtained with the PICARD/SODISM space-based instrument at 607.1 nm. The PICARD solar radius ( ) is 695 823
  145 km (959.40
  0.20 arcsec;
  ) using the IAU definition of the solar radius, where
  =
=  km. The standard deviation of the
  solar radius median value is
  44 km. We find a PICARD solar radius value (
 ) higher than that of the IAU (
 ). The value adopted by the IAU is defined by the layer where the optical depth of Rosseland is equal to 2/3 (or
  model-dependent definition). The value of Haberreiter et al. (2008) is based on two helioseismic estimates (f modes; and not three) and one transit measurement (SDM) that was previously corrected to be reduced to
  . The third measurement, which should not be there, decreases the average value significantly. The IAU value may therefore be considered underestimated, which is in line with the result we propose from PICARD analysis as a reference.
The PICARD/SODISM analysis provides a result of the solar radius with a realistic uncertainty budget and a combined standard uncertainty of the individual standard uncertainties ( ). The error derived from the PICARD on-board timing is certainly overestimated. Recent analyses showed that the on-board timing is close to zero for differential measurements during the Venus transit (
 6 h), which may reduce the combined uncertainty from
  145 to
  132 km at 607.1 nm.
Acknowledgments
This work was supported by Programme National Soleil-Terre (PNST, France) and CNES (Centre National d’Études Spatiales, France). The developing institutes of the PICARD SOL mission and PICARD/SODISM are LATMOS and OCA. This work is dedicated to the memory of Mireille Meissonnier, who was a key person at the beginning of the PICARD program in LATMOS (formerly Service d’Aéronomie du CNRS). The authors would also like to thank the referee for their valuable comments and suggestions that improved the quality of the manuscript.
References
- Assus, P., Borgnino, J., Martin, F., et al. 2002. in Astronomical Site Evaluation in the Visible and Radio Range, eds. J. Vernin, Z. Benkhaldoun, & C. Muñoz-Tuñón, ASP Conf. Ser. 266, 134 [NASA ADS] [Google Scholar]
- Auwers, A. 1891, Astron. Nachr., 128, 361 [NASA ADS] [CrossRef] [Google Scholar]
- Brown, T. M., & Christensen-Dalsgaard, J. 1998, ApJ, 500, L195 [NASA ADS] [CrossRef] [Google Scholar]
- Brown, T. M., Elmore, D. F., Lacey, L., & Hull, H. 1982, Appl. Opt., 21, 3588 [NASA ADS] [CrossRef] [PubMed] [Google Scholar]
- Capitaine, N., Wallace, P. T., & Chapront, J. 2003, A&A, 412, 567 [NASA ADS] [CrossRef] [EDP Sciences] [Google Scholar]
- Ciddor, P. E. 1996, Appl. Opt., 35, 1566 [NASA ADS] [CrossRef] [PubMed] [Google Scholar]
- Duda, R. O. & Hart, P.E. 1972, Commun. Assoc. Comp. Machin., 15, 11 [Google Scholar]
- Emilio, M., Kuhn, J. R., Bush, R. I., & Scholl, I. F. 2012, ApJ, 750, 135 [NASA ADS] [CrossRef] [Google Scholar]
- Emilio, M., Couvidat, S., Bush, R. I., Kuhn, J. R., & Scholl, I. F. 2015, ApJ, 798, 48 [NASA ADS] [CrossRef] [Google Scholar]
- Fienga, A., Manche, H., Laskar, J., & Gastineau, M. 2008, A&A, 477, 315 [NASA ADS] [CrossRef] [EDP Sciences] [Google Scholar]
- Fried, D. L. 1965, J. Opt. Soc. Am., 55, 1427 [NASA ADS] [CrossRef] [Google Scholar]
- Haberreiter, M., Schmutz, W., & Kosovichev, A. G. 2008, ApJ, 675, L53 [NASA ADS] [CrossRef] [Google Scholar]
- Hauchecorne, A., Meftah, M., Irbah, A., et al. 2014, ApJ, 783, 127 [NASA ADS] [CrossRef] [Google Scholar]
- Hestroffer, D., & Magnan, C. 1998, A&A, 333, 338 [NASA ADS] [Google Scholar]
- Hough, P. V. C. 1962, Method and means for recognizing complex patterns, U.S. Patent 3, 069, 654 (Washington: United States Atomic Energy Comission) [Google Scholar]
- Ikhlef, R., Corbard, T., Morand, F., et al. 2016, MNRAS, 458, 517 [NASA ADS] [CrossRef] [Google Scholar]
- Irbah, A., Corbard, T., Assus, P., et al. 2010, Proc. SPIE, 7735, 77356F [CrossRef] [Google Scholar]
- Irbah, A., Borgnino, J., Djafer, D., Damé, L., & Keckhut, P. 2016, A&A, 591, A150 [NASA ADS] [CrossRef] [EDP Sciences] [Google Scholar]
- Kolmogorov, A. 1941, Akad Nauk SSSR Dokl., 30, 301 [Google Scholar]
- Lamy, P., Prado, J.-Y., Floyd, O., et al. 2015, Sol. Phys., 290, 2617 [NASA ADS] [CrossRef] [Google Scholar]
- Meftah, M., Corbard, T., Irbah, A., et al. 2014a, A&A, 569, A60 [NASA ADS] [CrossRef] [EDP Sciences] [Google Scholar]
- Meftah, M., Hauchecorne, A., Crepel, M., et al. 2014b, Sol. Phys., 289, 1 [NASA ADS] [CrossRef] [Google Scholar]
- Meftah, M., Hochedez, J.-F., Irbah, A., et al. 2014c, Sol. Phys., 289, 1043 [NASA ADS] [CrossRef] [Google Scholar]
- Neckel, H. 2005, Sol. Phys., 229, 13 [NASA ADS] [CrossRef] [Google Scholar]
- Prša, A., Harmanec, P., Torres, G., et al. 2016, AJ, 152, 41 [NASA ADS] [CrossRef] [Google Scholar]
- Roddier, F. 1981, in Progress in Optics (Amsterdam: North-Holland Publishing Co.), 19, 281–376 [NASA ADS] [CrossRef] [Google Scholar]
- Rozelot, J. P., Kosovichev, A., & Kilcik, A. 2015, ApJ, 812, 91 [NASA ADS] [CrossRef] [Google Scholar]
- Seidelmann, P. K. 1992, Explanatory Supplement to the Astronomical Almanac. A revision to the Explanatory Supplement to the Astronomical Ephemeris and the American Ephemeris and Nautical Almanac (Mill Valley, CA: University Science Books), 780 [Google Scholar]
- Sofia, S., Girard, T. M., Sofia, U. J., et al. 2013, MNRAS, 436, 2151 [NASA ADS] [CrossRef] [Google Scholar]
- Tatarski, V. I. 1961, Wave Propagation in Turbulent Medium (New York: McGraw-Hill) [Google Scholar]
- Vaquero, J. M., Gallego, M. C., Ruiz-Lorenzo, J. J., et al. 2016, Sol. Phys., 291, 1599 [NASA ADS] [CrossRef] [Google Scholar]
- Vernazza, J. E., Avrett, E. H., & Loeser, R. 1981, ApJS, 45, 635 [Google Scholar]
Appendix A
PICARD/SODISM image during the 2012 transit of Venus
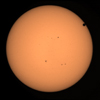 |
Fig. A1. PICARD/SODISM image of the Sun (at 607.1 nm) acquired on June 6, 2012, at 04H31 UTC during the Venus transit in 2012. |
Appendix B
Instrument and atmosphere system and convolution with the limb-darkening function
B.1. Optical transfer function of the instrument
The optical transfer function ( ) allows describing the formation of an image as a linear optical system in terms of angular frequency (f). Equation (B.1) is applicable in the case of an optical system with a circular pupil (
 ) at a given wavelength (
 ) and for an incoherent illumination.
  represents the diffraction cutoff frequency. Knowledge of the SODISM II PSF is fundamental.
![Mathematical equation: $$\begin{array}{lllllllllllllll}{{H_{\rm{t}}}\left( f \right) = \frac{2}{\pi }{\mkern 1mu} \left[ {\arccos \left( {\frac{f}{{{f_{{{\rm{c}}_{\rm{d}}}}}}}} \right) - \frac{f}{{{f_{{{\rm{c}}_{\rm{d}}}}}}}\sqrt {1 - {{\left( {\frac{f}{{{f_{{{\rm{c}}_{\rm{d}}}}}}}} \right)}^2}} } \right]}\\{{f_{{{\rm{c}}_{\rm{d}}}}} = \frac{{{D_{\rm{t}}}}}{\lambda }}\end{array}$$](/articles/aa/full_html/2018/08/aa32159-17/aa32159-17-eq217.gif) (B.1)
(B.1)
B.2. Structure function of the wavefront phase perturbations
A standard model of atmospheric turbulence used for observations was developed by Tatarski (1961) and by Fried (1965). This model is based on the work of Kolmogorov (1941) and is supported by a variety of experimental measurements. In the case of the Von Kármán model, the phase structure function ( ) is given by Eq. (B.2), where
  represents an angular frequency (radians
 ) and
) and  is the spatial coherence outer scale. This model depends on two optical atmospheric parameters (
 and
and  ). When considering the propagation of an electromagnetic wave through a turbulent atmosphere verifying the Kolmogorov model, the structure function of the wavefront phase perturbations measured at ground level is given by Eq. (B.3) (

 ); it is obtained for high values of the outer scale and depends only on the Fried parameter (
 ),
),![Mathematical equation: $$\begin{align} &D_{\emptyset}\left({\rho}\right) = \left[ 1 - 1.485 \left(\frac{{\rho}}{\mathcal{L}_0} \right)^{\frac{1}{3}} + 5.383 \left(\frac{{\rho}}{\mathcal{L}_0} \right)^{2} -6.281 \left(\frac{\rho}{\mathcal{L}_0} \right)^{\frac{7}{3}} \right] \nonumber \\ & \qquad\qquad{} \times 6.88 \left(\frac{{\rho}}{r_0} \right)^{\frac{5}{3}} \end{align}$$](/articles/aa/full_html/2018/08/aa32159-17/aa32159-17-eq228.gif) (B.2)
(B.2)
 (B.3)
(B.3)
B.3. Total transfer function (instrument and atmosphere)
The total transfer function (
 instrument + atmosphere) depends on the instrument optical transfer function (
 ) and the structure function based on the Kolmogorov model (Eq. (B.4)).
  represents the cutoff frequency associated with the turbulence.
 (B.4)
(B.4)
 (B.5)
(B.5)
Impulse response function of the instrument–atmosphere system and convolution
The inverse Fourier transform of the total transfer function ( ) represents the spatial impulse response function of the instrument–atmosphere system. The solar limb (LDF
 ) is obtained by deriving the 2D convolution product of the solar limb shape (LDF
 ) with the impulse response of the instrument–atmosphere system (Eq. (B.6)). The resulting solar radius will always be smaller than the “true value” of the Sun (
 ),
),![Mathematical equation: $ \begin{aligned} \text{LDF}_\text{t} = \text{LDF}_{\odot } \otimes \mathcal F ^{-1} \left[ \hat{F}_\text{T} \right] . \end{aligned} $](/articles/aa/full_html/2018/08/aa32159-17/aa32159-17-eq240.gif) (B.6)
(B.6)
For PICARD/SODISM II, the Kolmogorov model is applicable if the spatial coherence outer scale is greater than  (
( m, thus
  ). Moreover,
  is related to the FWHM of the seeing disk. For a telescope whose pupil diameter (
 ) is much greater than
  , we have FWHM
 . When

 , the resolution is limited by diffraction (
 for a circular pupil and with Airy function). When
 1 cm (poor observing site), it is understood that turbulence is a dominant effect and can have a catastrophic effect on the resolution of an image of a telescope.
All Tables
Recent results of the solar radius at 1 au using different methods and instruments for different wavelength ().
Error budget in the determination of the PICARD/SODISM solar radius (typical values in mas) with error types (random (R) or systematic (S)).
All Figures
|
Fig. 1. Impact of refraction on the measurements of the solar radius for several wavelengths. Solar radius bias ( |
| In the text | |
|
Fig. 2. Impulse response of the instrument–atmosphere system at 607.1 nm for several values of the Fried parameter ( |
| In the text | |
|
Fig. 3.
Top: image of the Sun made using the instrument–atmosphere system at 607.1 nm with |
| In the text | |
|
Fig. 4.
Top: solar limb-darkening functions (LDF |
| In the text | |
|
Fig. 5. Impact of the atmospheric turbulence on the solar radius determination (535.7, 607.1, and 782.2 nm) for a perfect instrument (theoretical PSF). Solar radius bias ( |
| In the text | |
|
Fig. 6. Solar radius variation with wavelength from PICARD SOL ground-based data (SODISM II data in red) and from PICARD spacecraft data (SODISM data in blue). The “chromospheric point” corresponds to the “PICARD” Ca II K line band. We also plot the solar radius variations with wavelength from data polynomial fits (Rozelot et al. 2015) |
| In the text | |
|
Fig. 7. Panel 1: PICARD/SODISM image (607.1 nm) acquired on June 6, 2012 at 04H31 UTC with a horizontal gradient. Panel 2: vertical gradient. Panel 3: norm of the gradient. Panel 4: norm of the gradient with the use of a threshold. |
| In the text | |
|
Fig. 8. Solar radius measurements (535.7, 607.1, and 782.2 nm) obtained from PICARD/SODISM measurements during the Venus transit. The solar radius at 1 au (no distortion correction) is plotted with black squares, and the solar radius at 1 au (with distortion correction) is plotted with circles. r represents the distance from the center of the Sun image on the SODISM CCD to the solar limb ( |
| In the text | |
|
Fig. A1. PICARD/SODISM image of the Sun (at 607.1 nm) acquired on June 6, 2012, at 04H31 UTC during the Venus transit in 2012. |
| In the text | |
Current usage metrics show cumulative count of Article Views (full-text article views including HTML views, PDF and ePub downloads, according to the available data) and Abstracts Views on Vision4Press platform.
Data correspond to usage on the plateform after 2015. The current usage metrics is available 48-96 hours after online publication and is updated daily on week days.
Initial download of the metrics may take a while.