Fig. 9
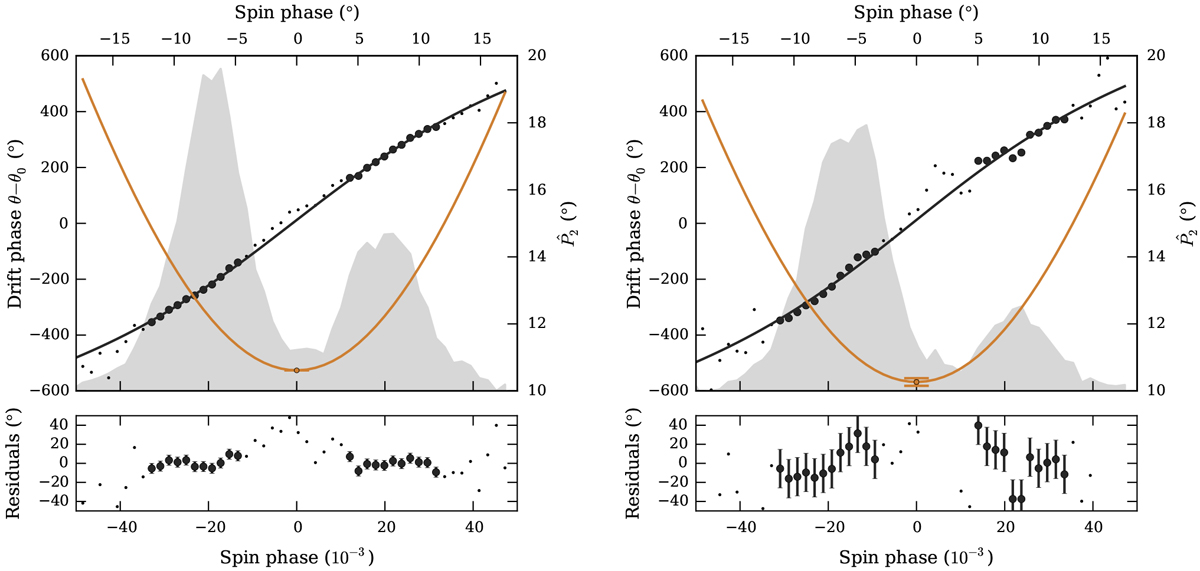
Unwrapped phase tracks, θ(ϕ) from Eq. (6) (black dots) at the Fourier frequencies corresponding to the
![]() peaks intwo LRF spectra with relatively strong (left) and weak (right) drifting features. The θ(ϕ) from the longitude region around the peaks of the average profile (larger markers) were used to fit the number of sparks in the carousel according to Eq. (9). Black lines mark an example of such fit performed with the standard set of geometry/aliasing parameters (see text for details), and the bottom panels show the residuals together with the fitted θ(ϕ) uncertainty. The orange line depicts the longitudinal separation between subpulses,
peaks intwo LRF spectra with relatively strong (left) and weak (right) drifting features. The θ(ϕ) from the longitude region around the peaks of the average profile (larger markers) were used to fit the number of sparks in the carousel according to Eq. (9). Black lines mark an example of such fit performed with the standard set of geometry/aliasing parameters (see text for details), and the bottom panels show the residuals together with the fitted θ(ϕ) uncertainty. The orange line depicts the longitudinal separation between subpulses,
![]() , computedby differentiating the fit line (Eq. (5)). The orange error bar at ϕ = 0 marks the
, computedby differentiating the fit line (Eq. (5)). The orange error bar at ϕ = 0 marks the ![]() uncertainty derived from the uncertainty in fitted N. The average profile of the pulse sequence is shown with shades of grey. For convenience, since
uncertainty derived from the uncertainty in fitted N. The average profile of the pulse sequence is shown with shades of grey. For convenience, since
![]() is measured in degrees, the top axis shows the spin longitude ϕ in the same units.
is measured in degrees, the top axis shows the spin longitude ϕ in the same units.
Current usage metrics show cumulative count of Article Views (full-text article views including HTML views, PDF and ePub downloads, according to the available data) and Abstracts Views on Vision4Press platform.
Data correspond to usage on the plateform after 2015. The current usage metrics is available 48-96 hours after online publication and is updated daily on week days.
Initial download of the metrics may take a while.