Fig. 7
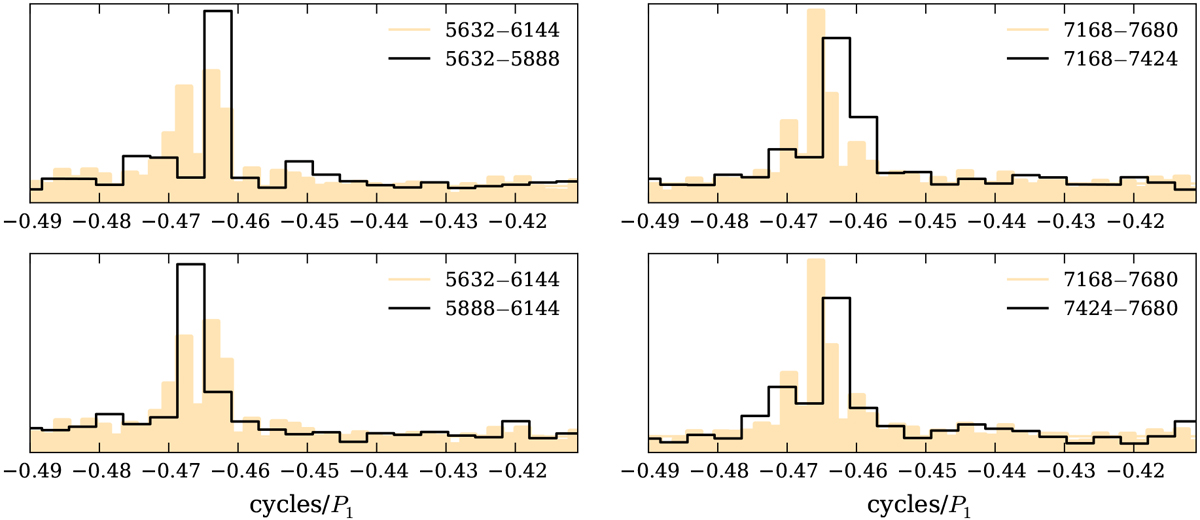
On-pulse averaged LRF spectra for two 512-pulse sequences (light colour, filled) together with the LRF spectra computed for the first and last 256 pulses of each pulse sequence (black, empty). Only the Fourier frequencies around the B-modefeature are shown. The pulse numbers in the legend are counted from the closest Q-to-B transition. Left: example of an LRF spectrum with two peaks that are resolved into a single peak that changes its position with time. All double features with clearly separated peaks were resolved in this way. Right: example of an LRF spectrum for a 512-pulse sequence that shows the peak offset from the peaks in the LRF spectra of the subsequences. This behaviour might be explained by phase jumps within the pulse sequence.
Current usage metrics show cumulative count of Article Views (full-text article views including HTML views, PDF and ePub downloads, according to the available data) and Abstracts Views on Vision4Press platform.
Data correspond to usage on the plateform after 2015. The current usage metrics is available 48-96 hours after online publication and is updated daily on week days.
Initial download of the metrics may take a while.