Fig. 6
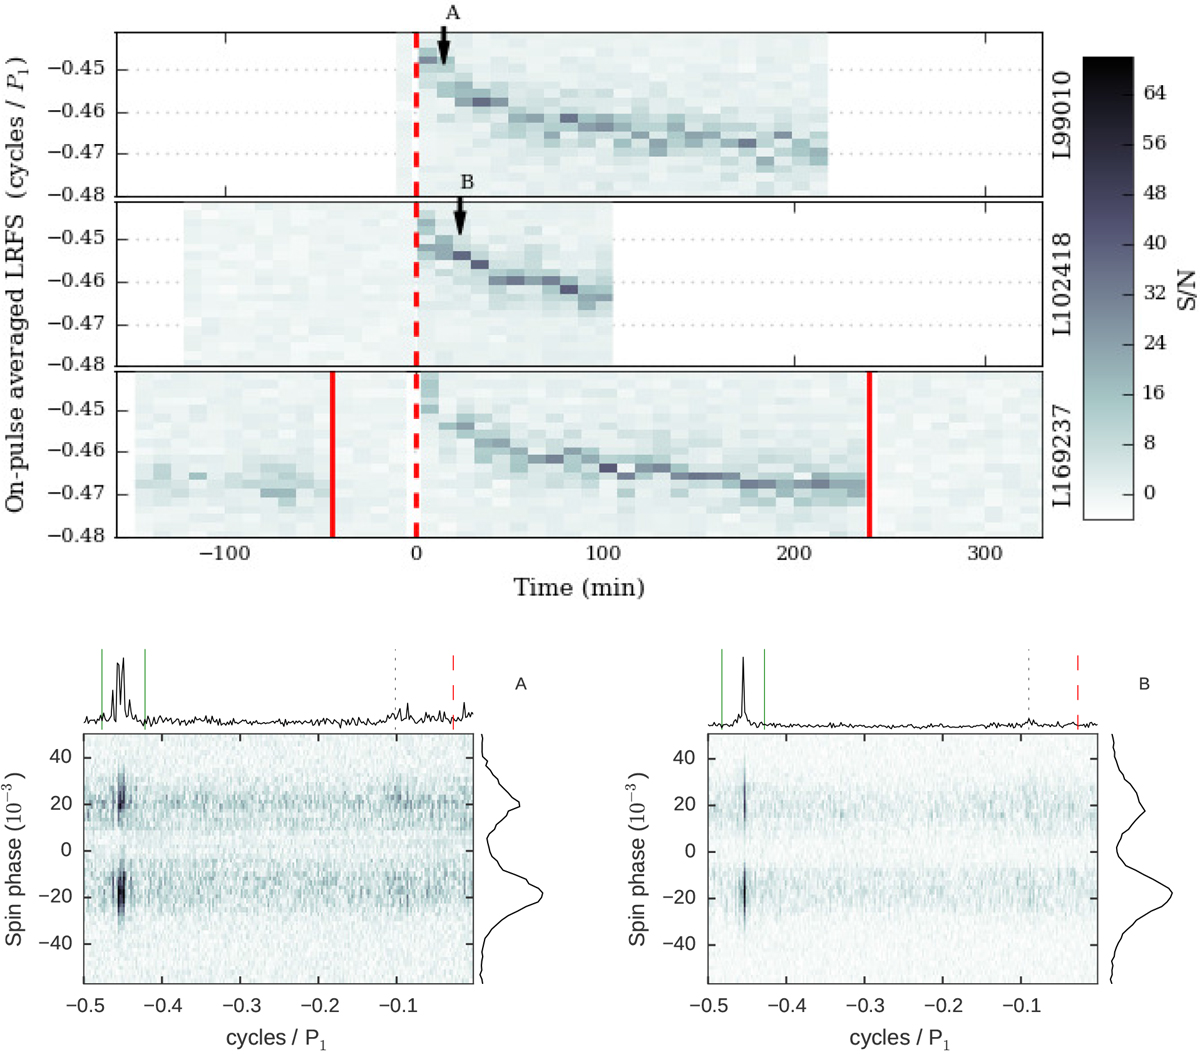
Topplot: stack of LRF power spectra, integrated within the on-pulse window. On the X-axis, each column corresponds to the LRF spectrum computed from 512-pulse (≈9 min) pulse stacks. Only the Fourier frequencies around the B-mode feature are shown. The S/N ratio is shown with colour. Similarly to B14, observations are aligned by the Q-to-B transition. Vertical solid lines mark B-to-Q transitions, and dashed lines show the Q-to-B transitions. The observed
![]() slowly evolves with time since the B-mode onset and also exhibits strong random fluctuation around the general trend. Bottom row: two examples of individual LRF spectra showing different types of P3 behaviour: multiple peaks (A) and a single peak (B). The average profiles for the corresponding pulse sequences are plotted in the side panel. Two solid vertical lines mark the supposed position of the sidelobes (for the highest S/N peak in A), calculated for the 20-spark carousel from DR01. The dotted line shows the first-degree alias of the second harmonic frequency of the highest S/N peak, and the dashed line marks the frequency of the supposed 37P1 modulation from Asgekar & Deshpande (2001).
slowly evolves with time since the B-mode onset and also exhibits strong random fluctuation around the general trend. Bottom row: two examples of individual LRF spectra showing different types of P3 behaviour: multiple peaks (A) and a single peak (B). The average profiles for the corresponding pulse sequences are plotted in the side panel. Two solid vertical lines mark the supposed position of the sidelobes (for the highest S/N peak in A), calculated for the 20-spark carousel from DR01. The dotted line shows the first-degree alias of the second harmonic frequency of the highest S/N peak, and the dashed line marks the frequency of the supposed 37P1 modulation from Asgekar & Deshpande (2001).
Current usage metrics show cumulative count of Article Views (full-text article views including HTML views, PDF and ePub downloads, according to the available data) and Abstracts Views on Vision4Press platform.
Data correspond to usage on the plateform after 2015. The current usage metrics is available 48-96 hours after online publication and is updated daily on week days.
Initial download of the metrics may take a while.