Fig. 3
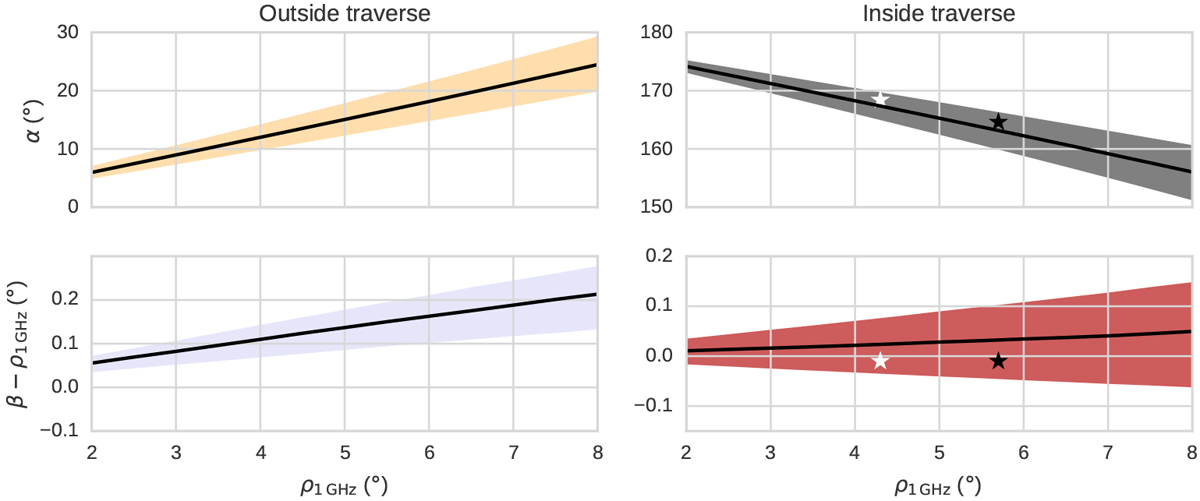
Pulsar orientation angles based on the analysis of frequency-dependent component separation and the PA sweep rate versus the assumed value of the emission cone opening angle at 1 GHz, ρ1 GHz. The black lines show α(ρ1 GHz) and β(ρ1 GHz) for RPA = −2.9°/°. Shaded regions mark a ± 0.5°/° uncertainty in RPA, where the lower edge corresponds to a lower absolute value of RPA. The stars mark the DR01 geometry solutions corresponding to the inner and outer cone ρ1 GHz (white and black, respectively). The angles were converted into the EW01 notation according to Table 2.
Current usage metrics show cumulative count of Article Views (full-text article views including HTML views, PDF and ePub downloads, according to the available data) and Abstracts Views on Vision4Press platform.
Data correspond to usage on the plateform after 2015. The current usage metrics is available 48-96 hours after online publication and is updated daily on week days.
Initial download of the metrics may take a while.