Free Access
Fig. 16
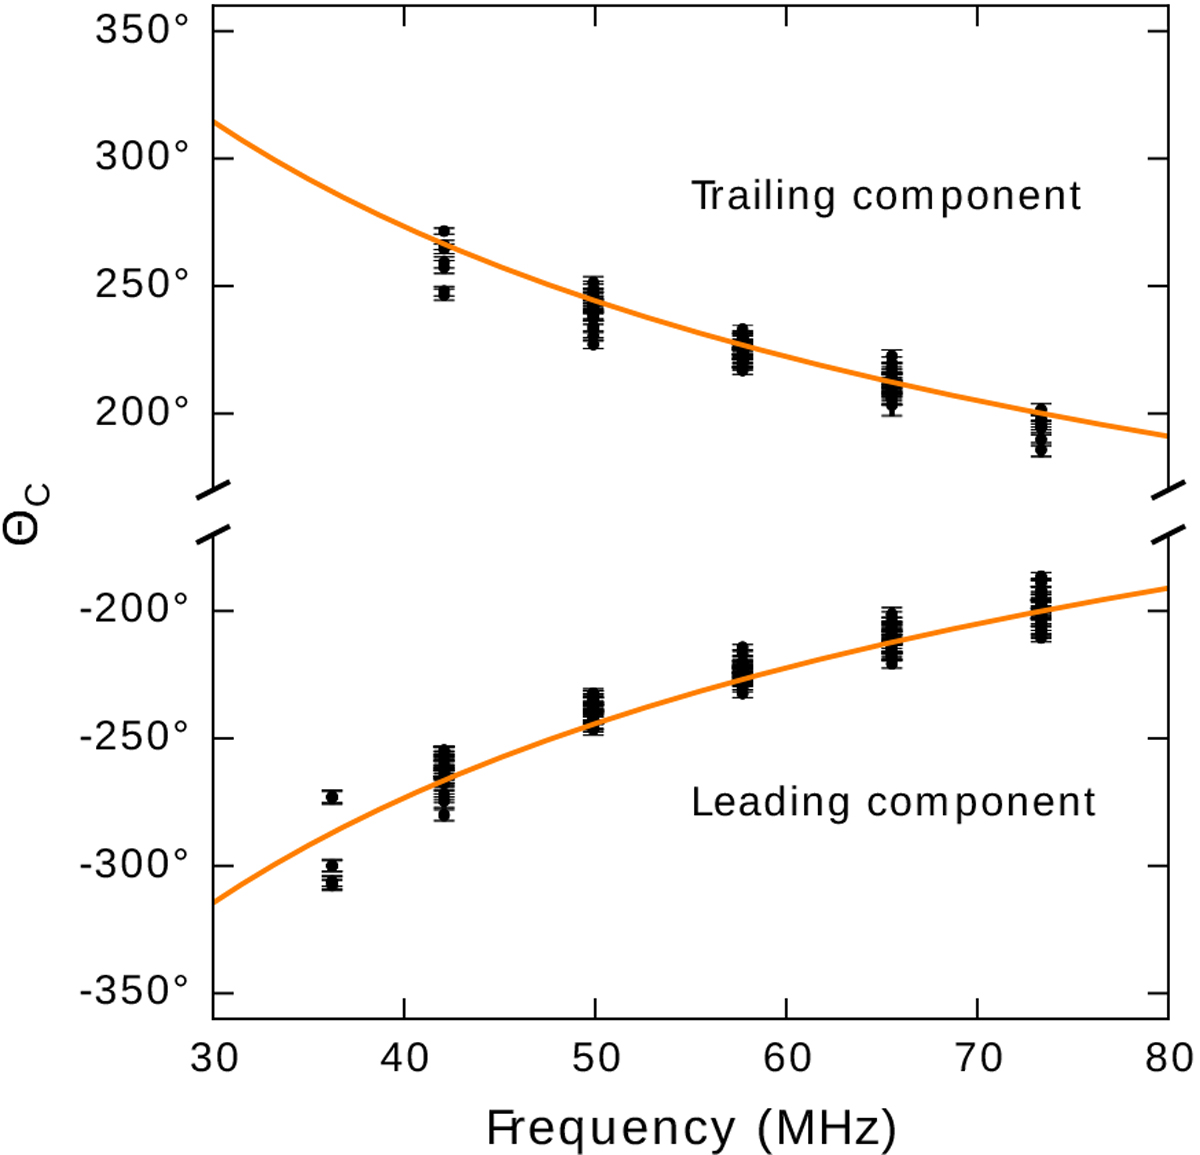
Black points show the drift phase ΘC vs. radio frequency for the leading and trailing drift tracks for all pulse stacks of the session L99010, where the fitted 2D Gaussians had an S∕N > 7. The orange lines mark the expected phase delay of the rotating carousel calculated according to Eq. (16).
Current usage metrics show cumulative count of Article Views (full-text article views including HTML views, PDF and ePub downloads, according to the available data) and Abstracts Views on Vision4Press platform.
Data correspond to usage on the plateform after 2015. The current usage metrics is available 48-96 hours after online publication and is updated daily on week days.
Initial download of the metrics may take a while.