Fig. 14
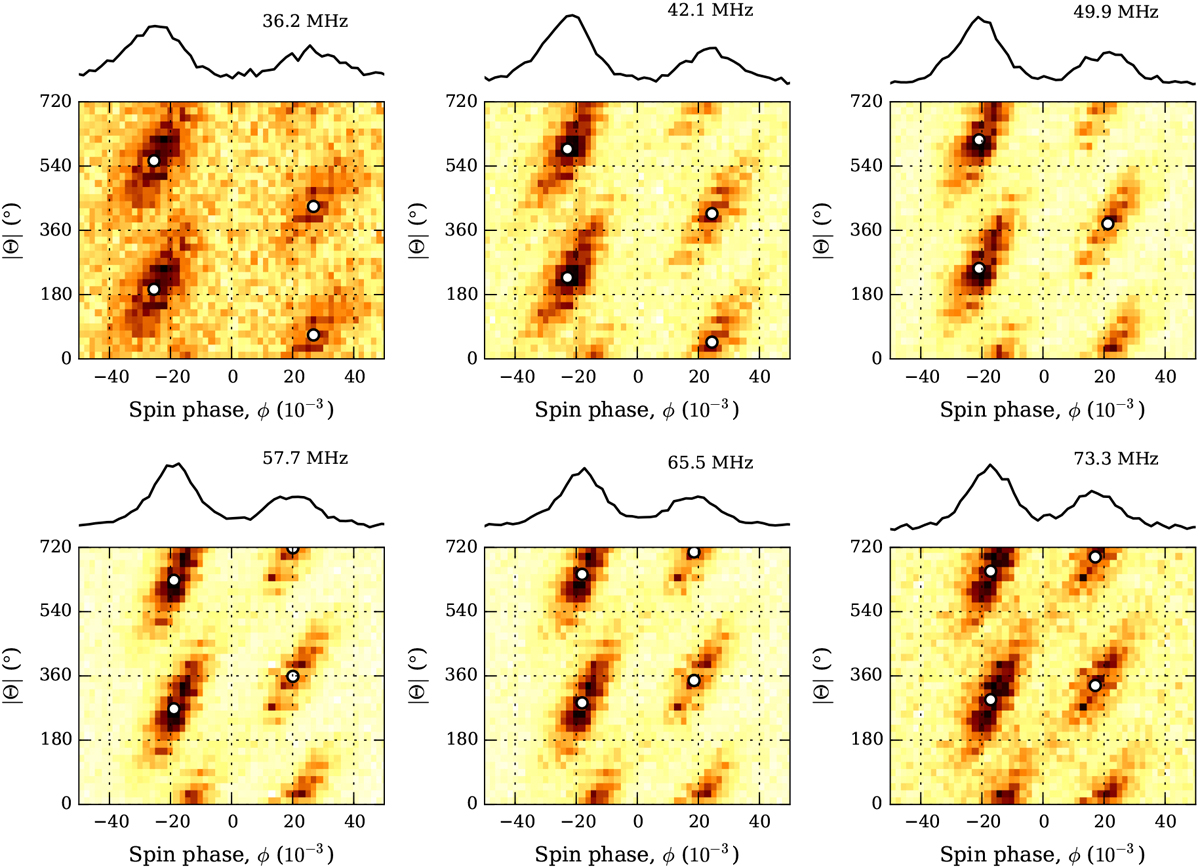
Example of a 512-pulse stack folded modulo ![]() for six radio frequencies within the LBA band. The modfold is repeated twice along the Y -axis to mitigate wrapping, and the corresponding average profile is plotted on top. White circles mark the centres of driftbands obtained from fitting 2D tilted Gaussians. As the radio frequency increases, the driftbands move towards each other both in ϕ (reflecting the behaviour of the average profile components) and in Θ.
for six radio frequencies within the LBA band. The modfold is repeated twice along the Y -axis to mitigate wrapping, and the corresponding average profile is plotted on top. White circles mark the centres of driftbands obtained from fitting 2D tilted Gaussians. As the radio frequency increases, the driftbands move towards each other both in ϕ (reflecting the behaviour of the average profile components) and in Θ.
Current usage metrics show cumulative count of Article Views (full-text article views including HTML views, PDF and ePub downloads, according to the available data) and Abstracts Views on Vision4Press platform.
Data correspond to usage on the plateform after 2015. The current usage metrics is available 48-96 hours after online publication and is updated daily on week days.
Initial download of the metrics may take a while.