Fig. 10
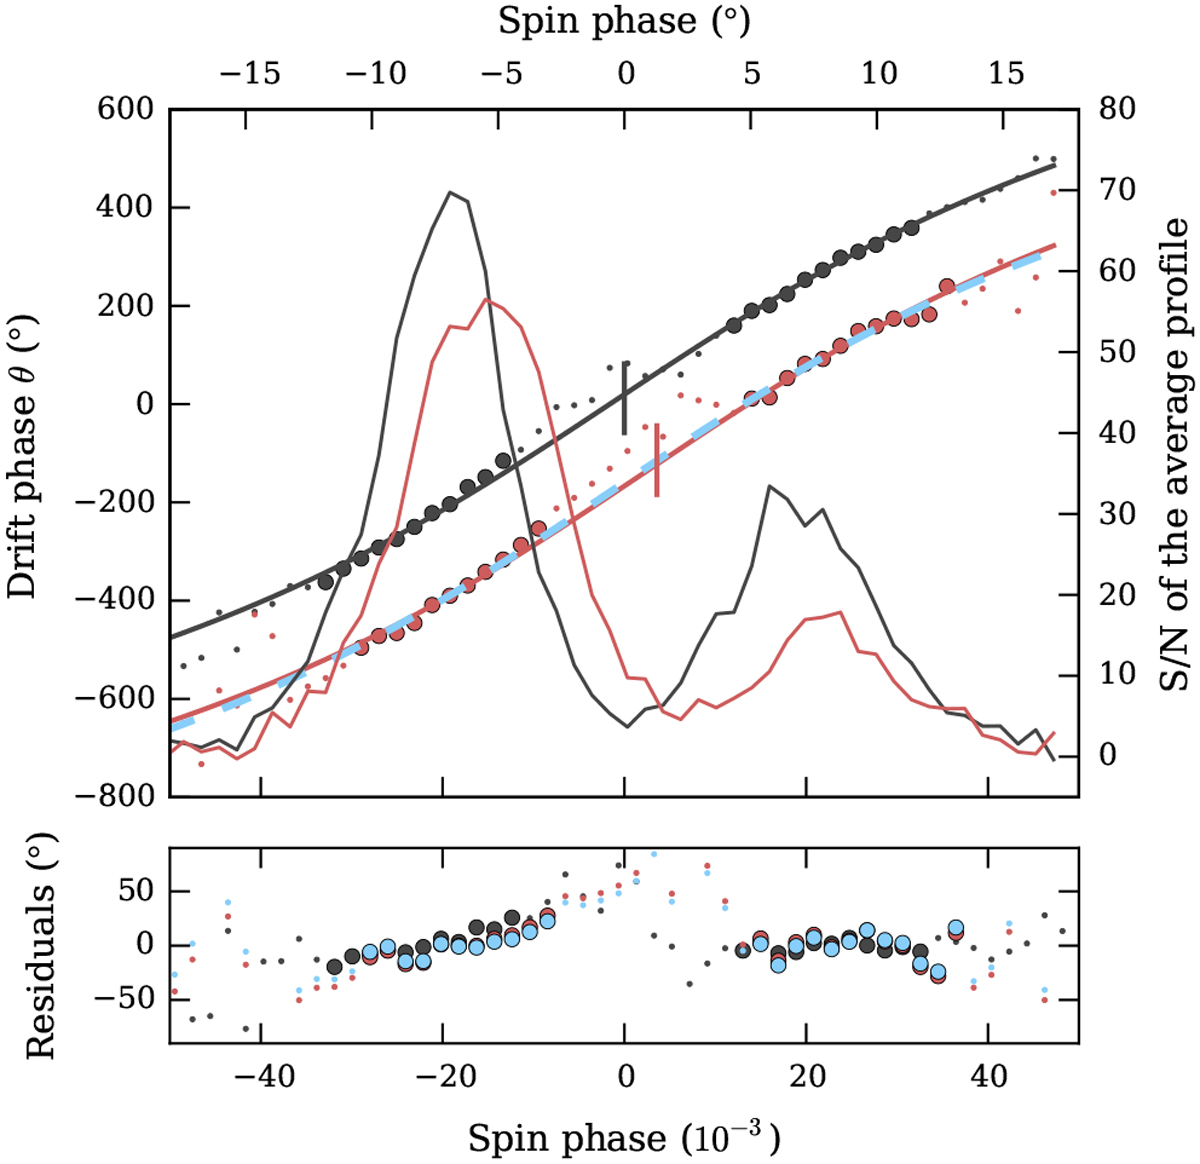
Phase tracks for the beginning (black) and the end (red) of the same B mode (observation L99010), with an artificial vertical offset added. The average profiles of the corresponding pulse sequences are plotted in the background with matching colours. The serifs mark the midpoint between profile components (see text for details). Lines show the fit with standard geometry/aliasing parameters. Solid lines correspond to the fit with fiducial longitude ϕ0 matching the midpoint between profile components. The light blue dashed line shows the fit to the late-mode phase track with ϕ0 fixed at the position of the midpoint between components at the onset of the B mode. Both constant and moving ϕ0 yield the same quality fits and an almost identical number of sparks N, and the change in ϕ0 is absorbed by fitted θ0.
Current usage metrics show cumulative count of Article Views (full-text article views including HTML views, PDF and ePub downloads, according to the available data) and Abstracts Views on Vision4Press platform.
Data correspond to usage on the plateform after 2015. The current usage metrics is available 48-96 hours after online publication and is updated daily on week days.
Initial download of the metrics may take a while.