Fig. 5
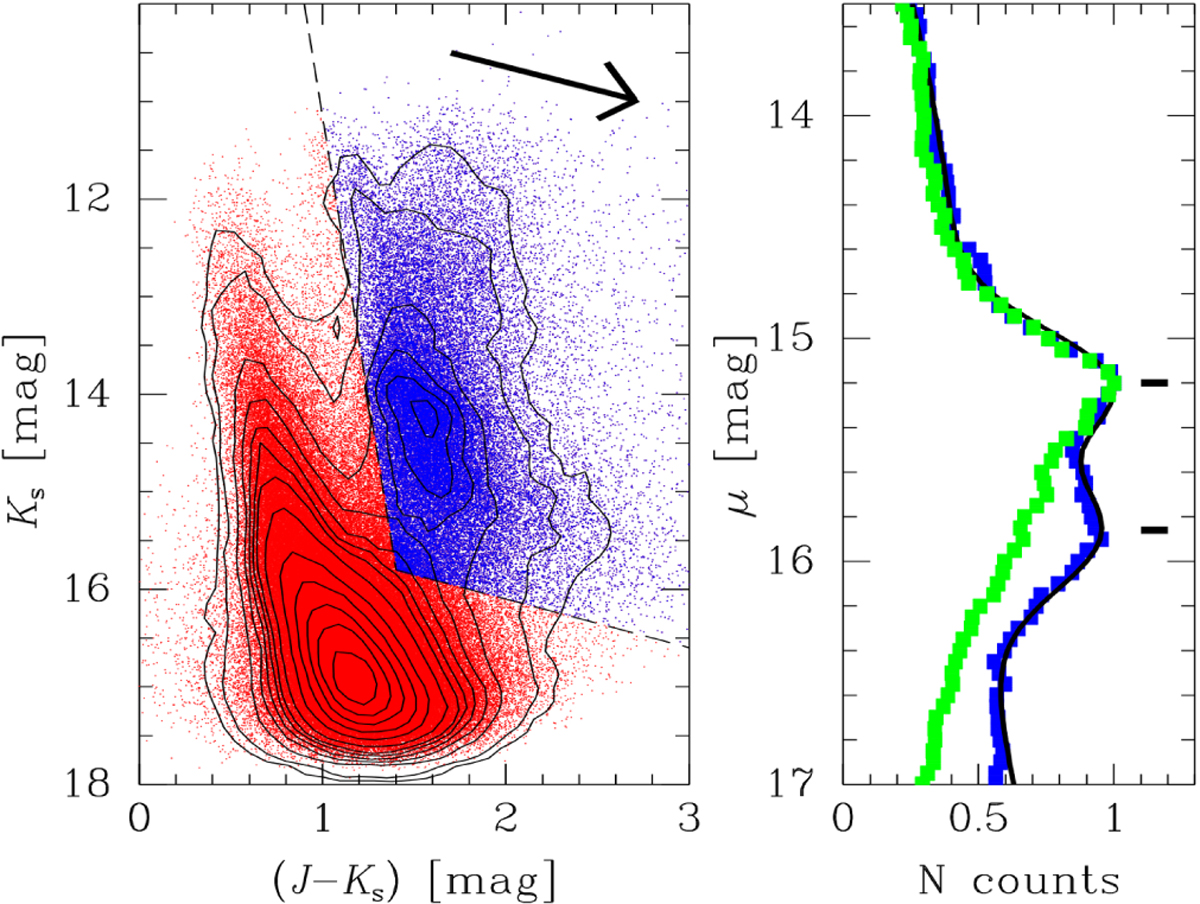
Left: Ks versus (J − Ks) CMD for the circular region around the window as shown in Fig. 1. The blue region was used to derive the RC mags and colours. The contours trace iso density levels. A reddening vector with the slope of AKs = 0.484 × E(J − Ks) is also shown. Right: normalised density distribution of selected RC versus distance moduli of the low extinction window (blue squares) and of the comparison field (green squares).
Current usage metrics show cumulative count of Article Views (full-text article views including HTML views, PDF and ePub downloads, according to the available data) and Abstracts Views on Vision4Press platform.
Data correspond to usage on the plateform after 2015. The current usage metrics is available 48-96 hours after online publication and is updated daily on week days.
Initial download of the metrics may take a while.