Fig. 4
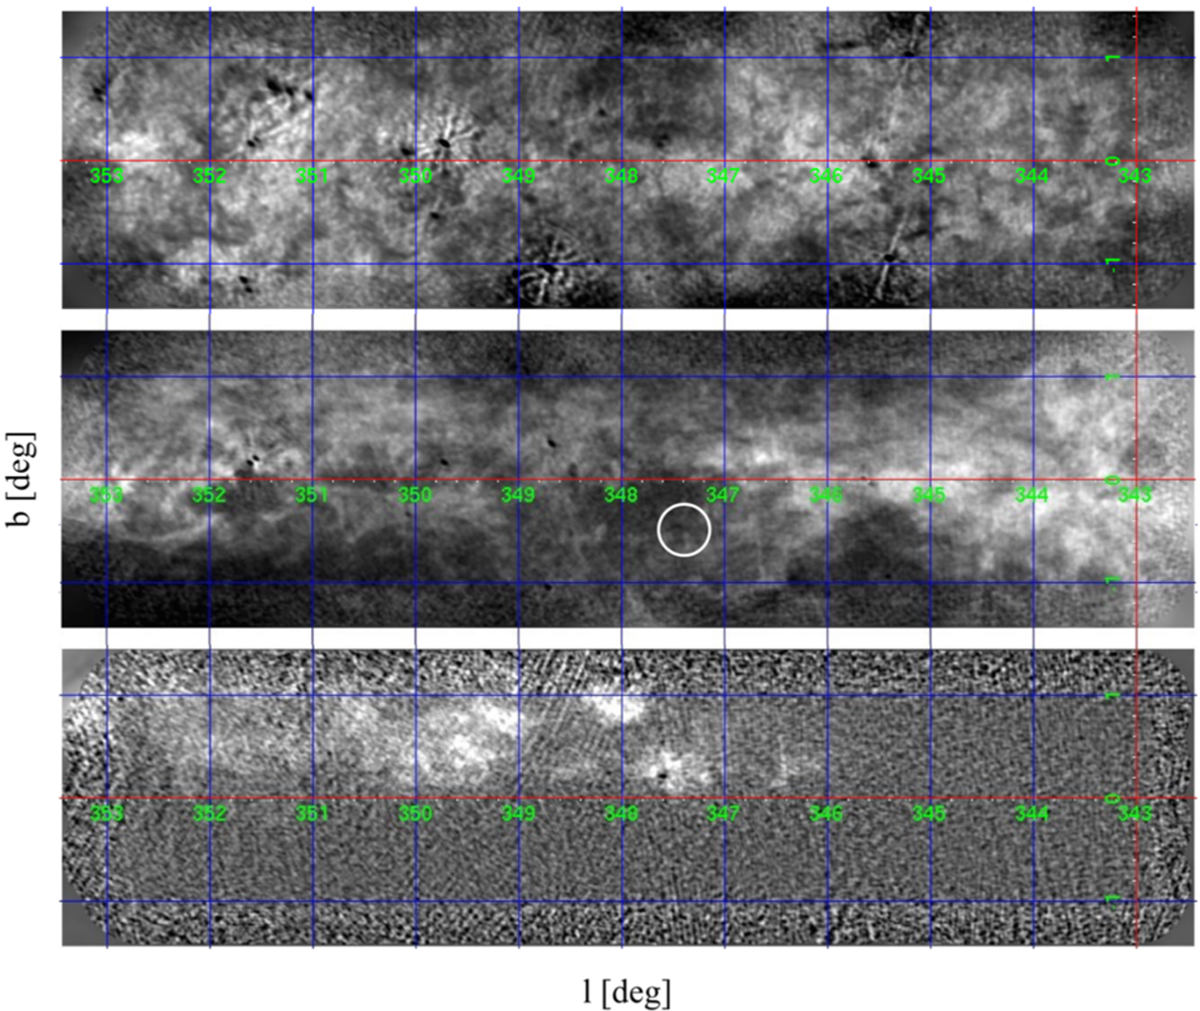
HI maps at different velocities for the inner Galactic plane, for 342.6 < l < 353.4 and − 1.4 < b < 1.4. Top: HI emission for velocities between − 15 and − 20 km s−1. Middle: same for velocities between − 30 and − 42 km s−1. The location of the low extinction window is indicated with the circle. Bottom: same for velocities between − 150 and − 185 km s−1.
Current usage metrics show cumulative count of Article Views (full-text article views including HTML views, PDF and ePub downloads, according to the available data) and Abstracts Views on Vision4Press platform.
Data correspond to usage on the plateform after 2015. The current usage metrics is available 48-96 hours after online publication and is updated daily on week days.
Initial download of the metrics may take a while.