Fig. 3
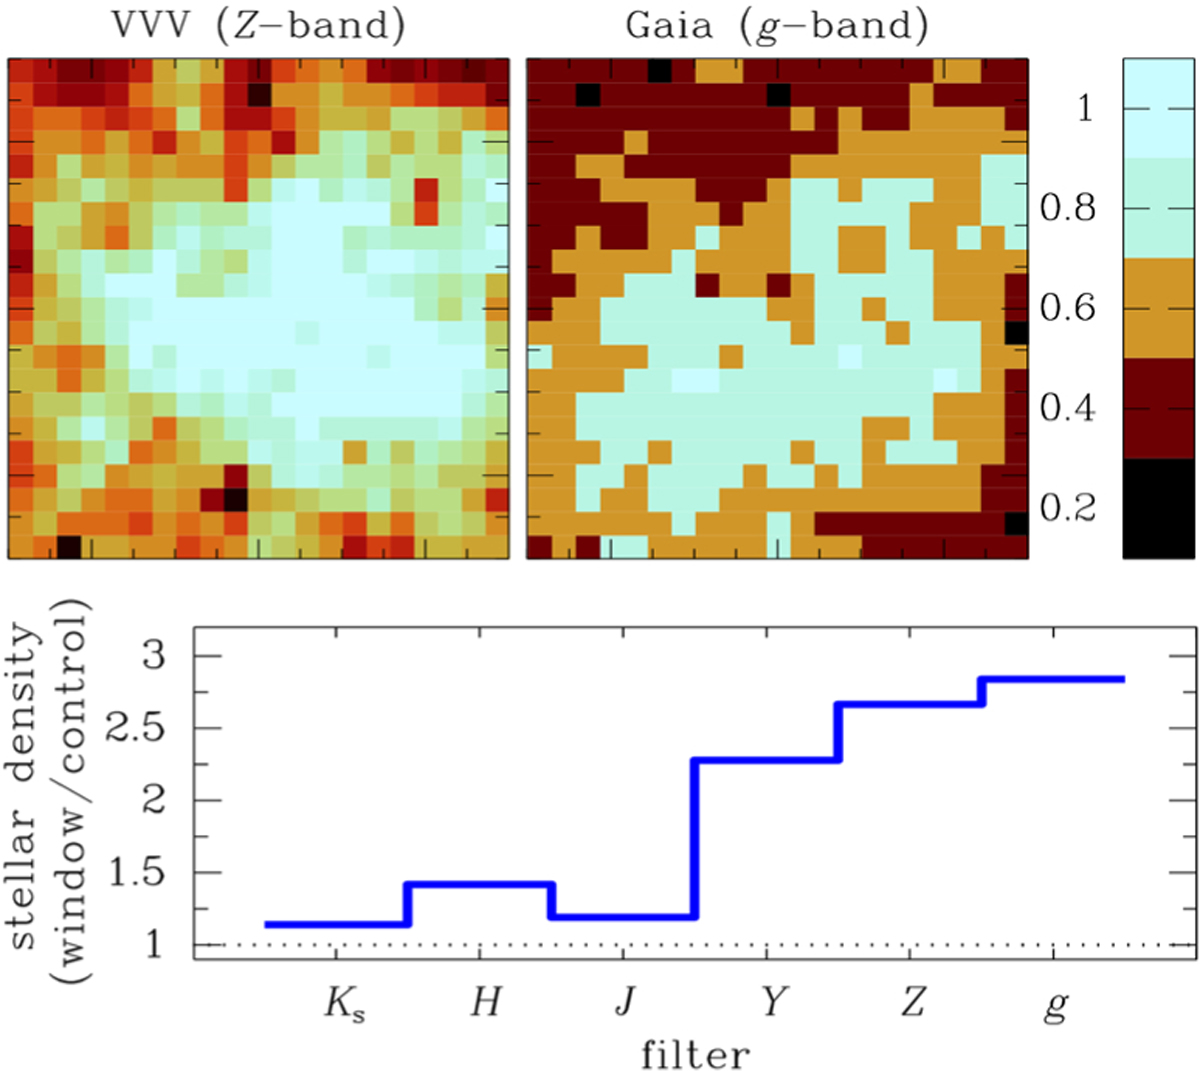
Top: same region of Fig. 2 as seen in the density maps of VVV (Z band) and Gaia (g band), normalised by the maximum value in each case. Vertical bar shows the colour code in the maps. Bottom: total number of sources in the low extinction window divided by the number of sources in the control field for the VVV filters and g band from Gaia.
Current usage metrics show cumulative count of Article Views (full-text article views including HTML views, PDF and ePub downloads, according to the available data) and Abstracts Views on Vision4Press platform.
Data correspond to usage on the plateform after 2015. The current usage metrics is available 48-96 hours after online publication and is updated daily on week days.
Initial download of the metrics may take a while.