Fig. 1
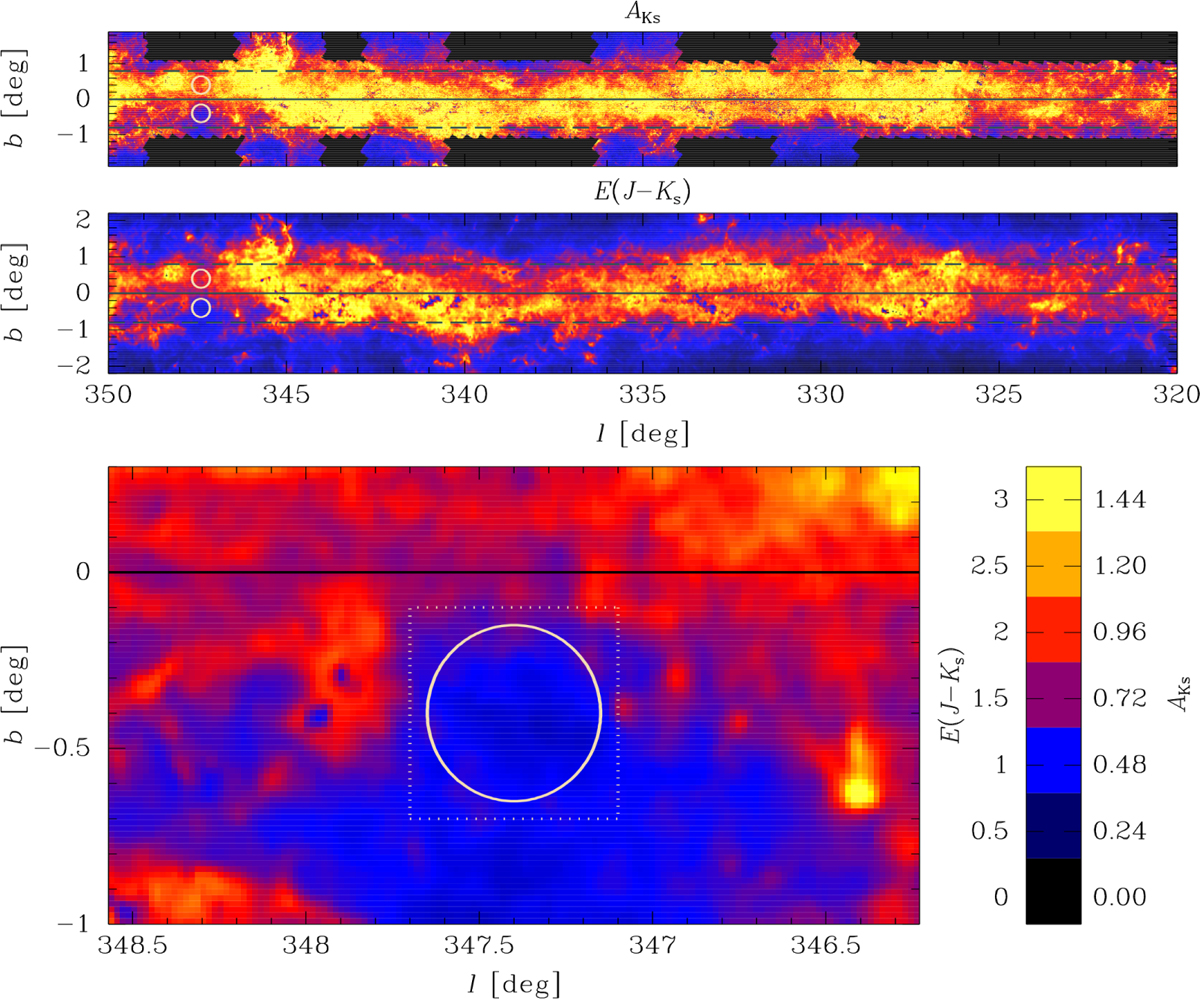
Extinction maps for the inner Galactic plane. Top panel: AKS extinction map, produced using the method of Majewski et al. (2011), covering 342 < l < 352, − 2 < b < +2 deg. Middle panel: EJKS map, produced using the method of Gonzalez et al. (2011a) for the same region (see Sect. 2). Horizontal lines are at b = 0, indicating the Galactic plane, and at |b| = 0.8. Circular areas mark the region around the window and the control field (see Sect. 2). Bottom panel: EJKS map zoomedin the window’s region. The squared and circular areas marked in white are described in Figs. 2 and 3. The horizontal solid line indicates the Galactic plane. The vertical bar shows the colour code for each map.
Current usage metrics show cumulative count of Article Views (full-text article views including HTML views, PDF and ePub downloads, according to the available data) and Abstracts Views on Vision4Press platform.
Data correspond to usage on the plateform after 2015. The current usage metrics is available 48-96 hours after online publication and is updated daily on week days.
Initial download of the metrics may take a while.