Fig. 9.
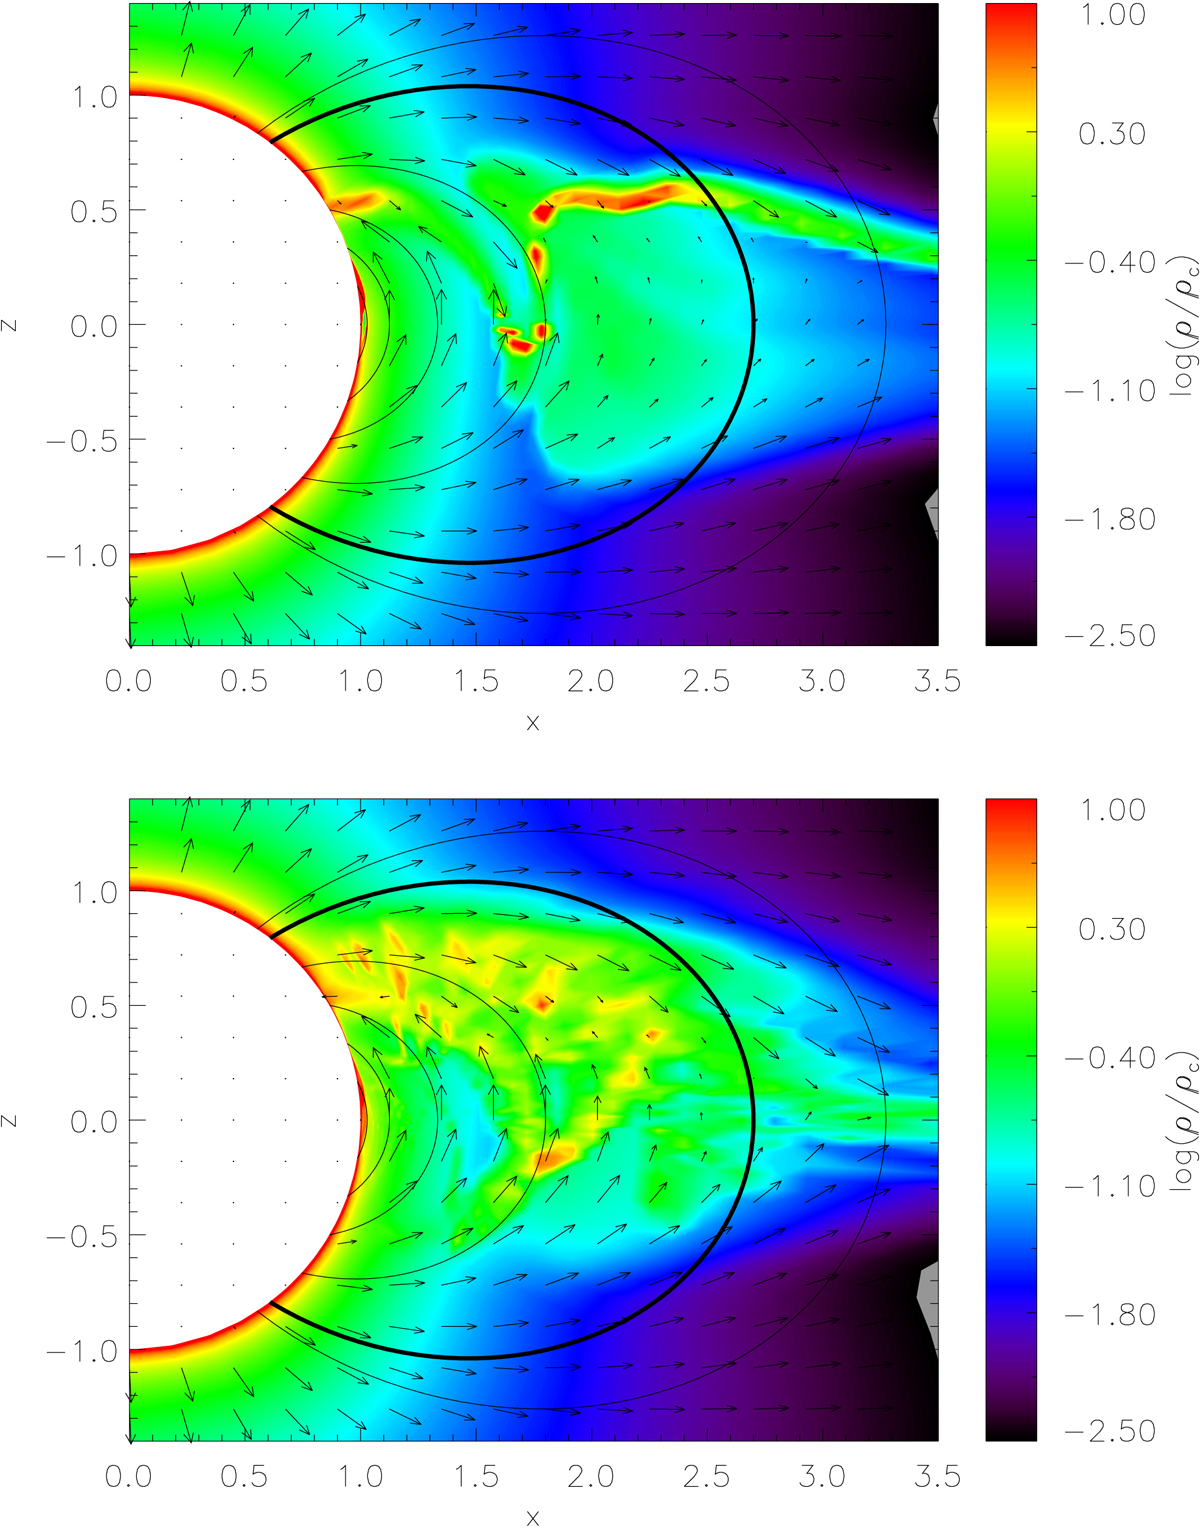
Upper panel: density structure for an example snapshot from the MHD simulations for HD 191612, as performed by Sundqvist et al. (2012). Lower panel: azimuthal average of the MHD simulations. In both figures, the density has been normalized by a typical down-flow density, ![]() , with ṀB= 0 from Table 5, and vesc ≈ 800 km s−1 the photospheric escape velocity. The velocity field is displayed by arrows, with the length of the velocity vectors limited to 0.5 vesc. We additionally show the dipole magnetic field of the ADM models used in Sect. 6.2 (solid lines, and thick solid line for RA = 2.7R∗). The corresponding magnetic axis is aligned with the z-axis. The grey colour corresponds to densities outside the range indicated on the right.
, with ṀB= 0 from Table 5, and vesc ≈ 800 km s−1 the photospheric escape velocity. The velocity field is displayed by arrows, with the length of the velocity vectors limited to 0.5 vesc. We additionally show the dipole magnetic field of the ADM models used in Sect. 6.2 (solid lines, and thick solid line for RA = 2.7R∗). The corresponding magnetic axis is aligned with the z-axis. The grey colour corresponds to densities outside the range indicated on the right.
Current usage metrics show cumulative count of Article Views (full-text article views including HTML views, PDF and ePub downloads, according to the available data) and Abstracts Views on Vision4Press platform.
Data correspond to usage on the plateform after 2015. The current usage metrics is available 48-96 hours after online publication and is updated daily on week days.
Initial download of the metrics may take a while.