Fig. 5.
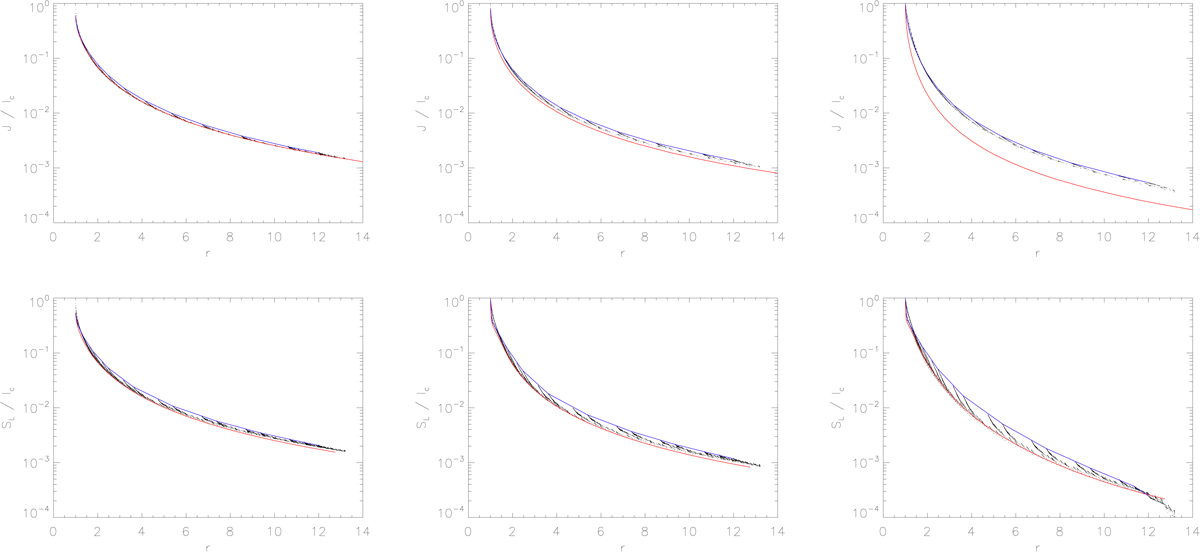
Top: mean intensities (scaled by the emitted intensity from the stellar core, Ic) for the continuum transport, with ϵc = 10−6, and kc = (100, 101, 102) corresponding to τr = (0.17, 1.7, 17.0), from left to right. Bottom: line source functions (scaled by Ic) assuming an optically thin continuum, and with ϵL = 10−6, and kL = (100, 103, 105) from left to right. The red line corresponds to the accurate 1D solution, the blue line is the solution along the x-axis, and the dots (mainly located in between the red and the blue line) correspond to the solution of (arbitrarily) selected grid points (only a subset of all grid points is shown to compress the images).
Current usage metrics show cumulative count of Article Views (full-text article views including HTML views, PDF and ePub downloads, according to the available data) and Abstracts Views on Vision4Press platform.
Data correspond to usage on the plateform after 2015. The current usage metrics is available 48-96 hours after online publication and is updated daily on week days.
Initial download of the metrics may take a while.