Fig. 3.
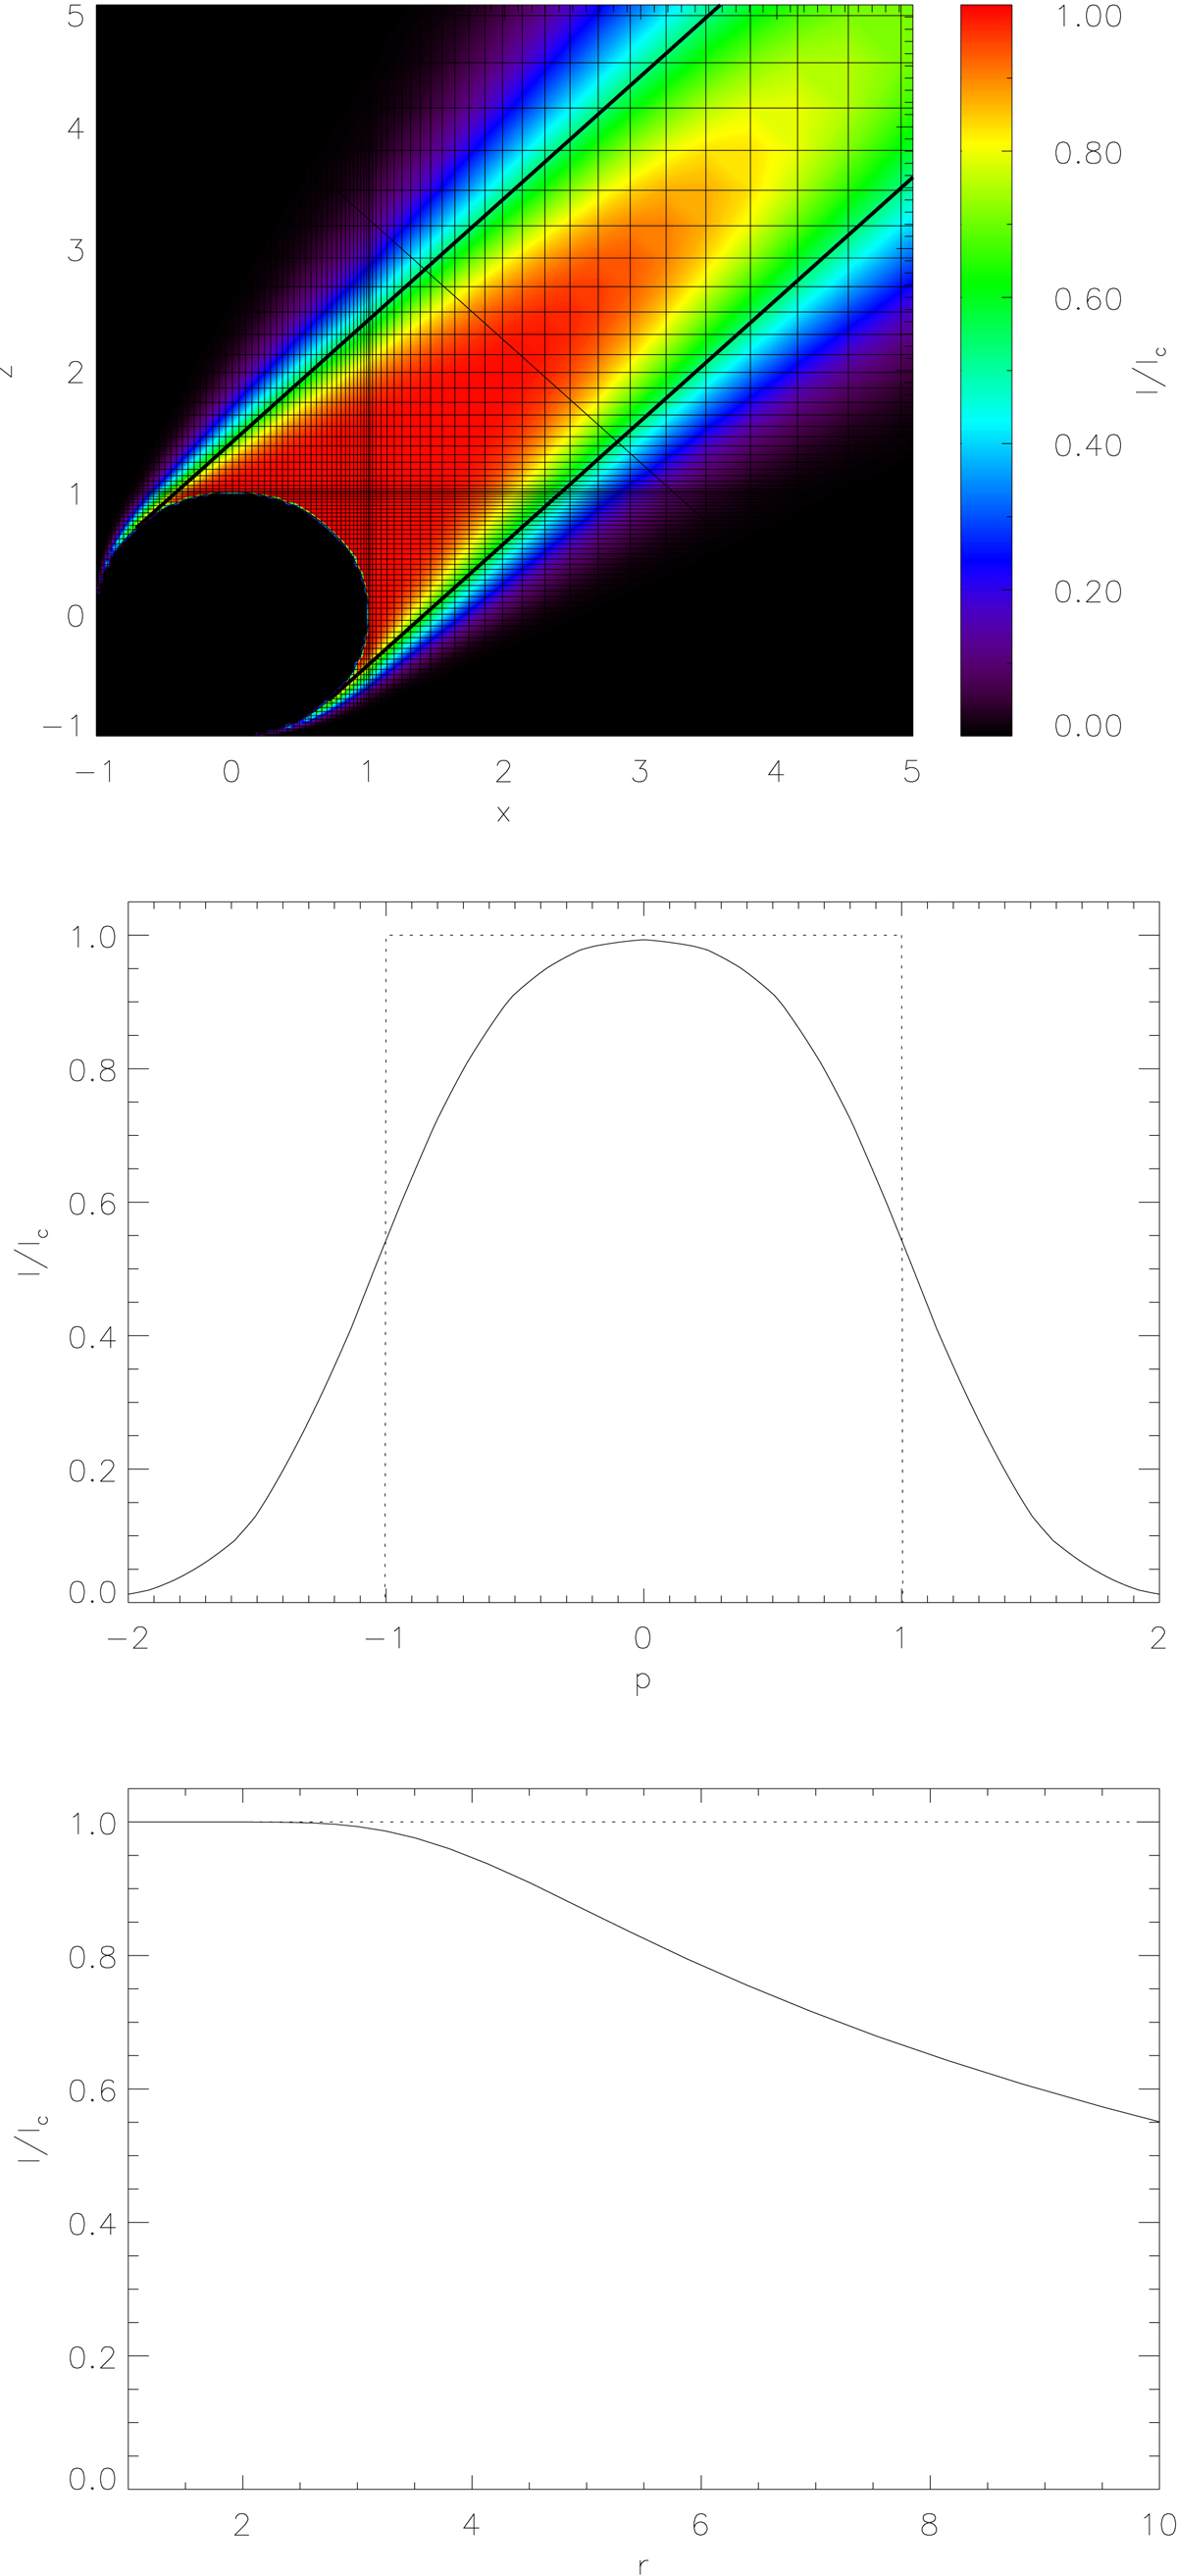
Top: specific intensities for direction n= (1, 0, 1) in the x–z-plane, for a zero-opacity model. Overplotted is the spatial grid with a typical size of Nx = Ny = Nz = 133 grid points. The thick lines indicate the theoretical boundary of the beam. Middle: projected intensity profile through the area indicated by a straight line in the top panel, covering all rays with direction n and impact parameter p = ±2R∗, and theoretical intensity profile denoted by dotted lines. The central distance from the origin is 3R∗. Bottom: specific intensity along n, compared to the theoretical value indicated by the dotted line.
Current usage metrics show cumulative count of Article Views (full-text article views including HTML views, PDF and ePub downloads, according to the available data) and Abstracts Views on Vision4Press platform.
Data correspond to usage on the plateform after 2015. The current usage metrics is available 48-96 hours after online publication and is updated daily on week days.
Initial download of the metrics may take a while.