Fig. B.1.
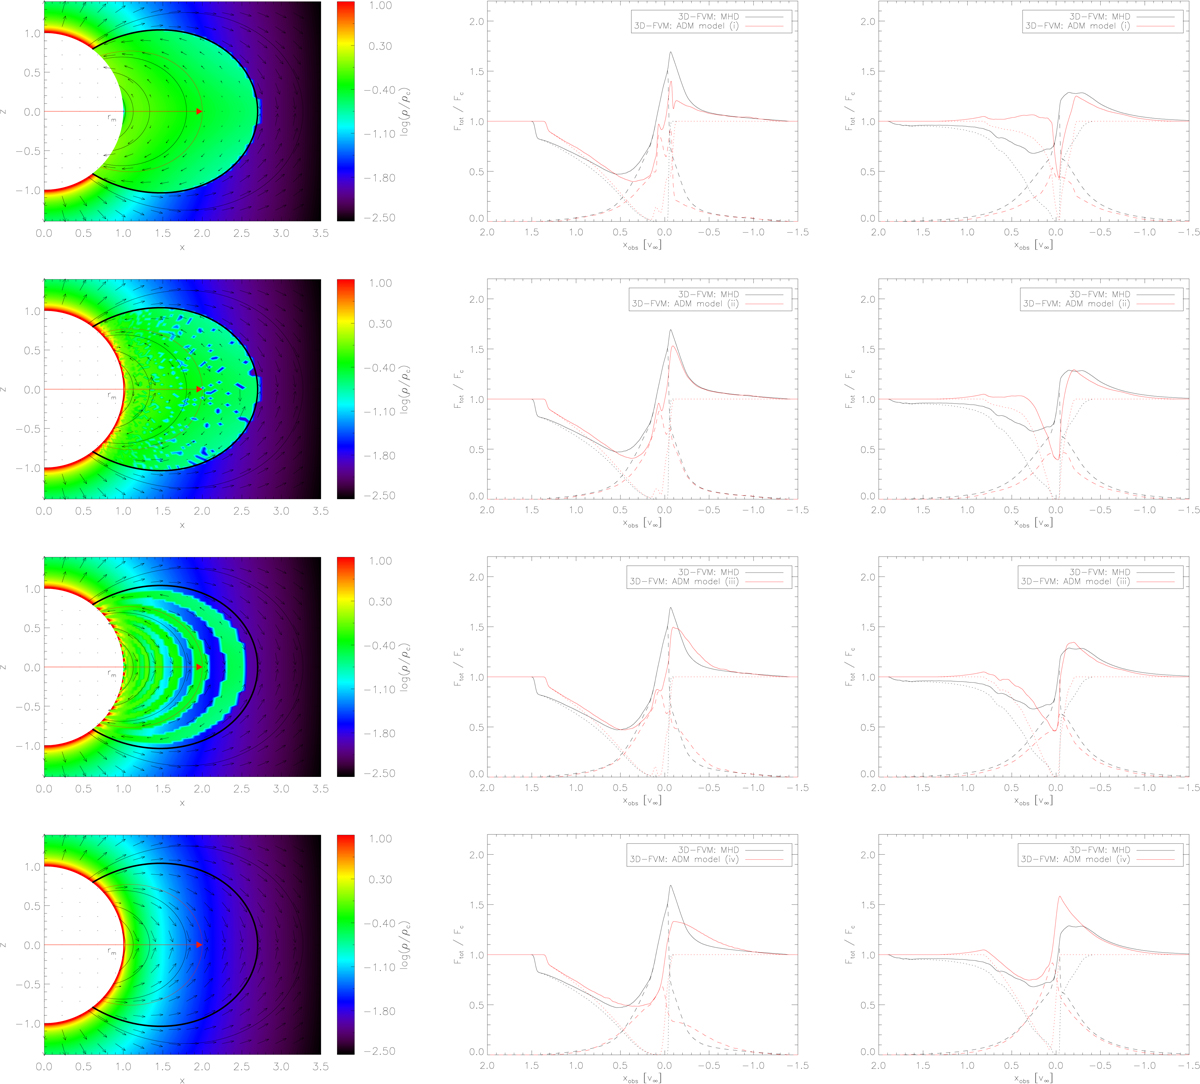
Left panel: as Fig. 9, but for the corresponding ADM model structures. To clarify the definition of the apex radius, rm, we have displayed a specific value, rm = 2R∗, as a red arrow, where this value corresponds to all points located on the red magnetic-field line. In the closed-field region (inside rm = RA, displayed by a thick line), the models contain, from top to bottom: (i) the cooled-downflow component alone. (ii) A statistical approach for the downflow and upflow component. (iii) Alternating flux tubes with cooled-downflow and wind-upflow component. (iv) The wind-upflow component alone. Middle panel: as Fig. 11, for pole-on observers, and for the different ADM models (i)–(iv). The dashed and dotted lines display the emission part and the absorption part of the line profiles, respectively. Right panel: as middle panel, but for equator-on observers.
Current usage metrics show cumulative count of Article Views (full-text article views including HTML views, PDF and ePub downloads, according to the available data) and Abstracts Views on Vision4Press platform.
Data correspond to usage on the plateform after 2015. The current usage metrics is available 48-96 hours after online publication and is updated daily on week days.
Initial download of the metrics may take a while.