Fig. 9
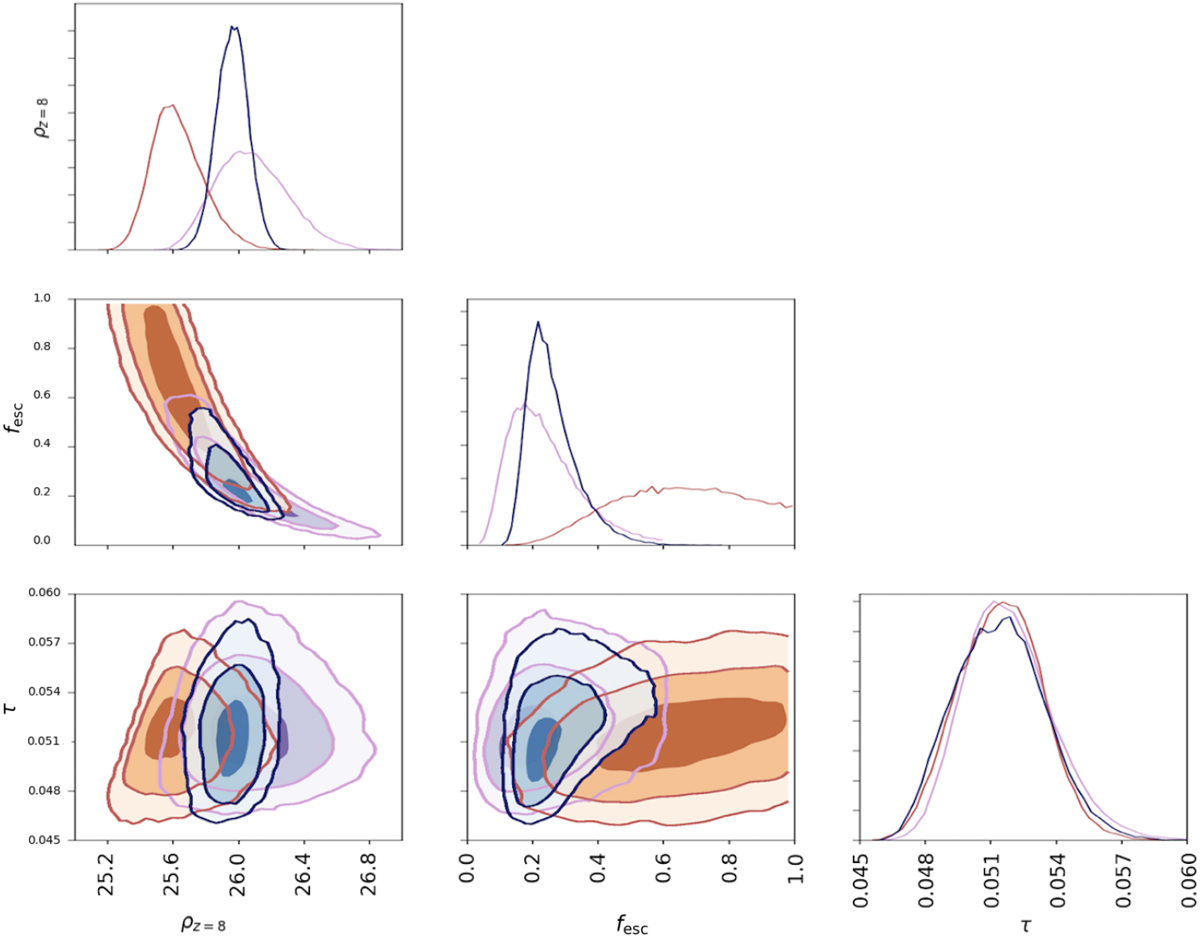
Result of the MCMC analysis for the parametrisation described in Eq. (3) with fesc added as a fitting parameter. Here, all three sets of observational data were used as constraints. The contours show the 1-, 2-, and 3-σ confidence levels for log(ρz=8), fesc and the derived parameter τ. Colours correspond to the different values of the magnitude limit used in the analysis: purple for Mlim =−10, blue for Mlim = −13 and orange for Mlim = −17. These results can be compared to reionisation histories displayed in Fig. 8a and b.
Current usage metrics show cumulative count of Article Views (full-text article views including HTML views, PDF and ePub downloads, according to the available data) and Abstracts Views on Vision4Press platform.
Data correspond to usage on the plateform after 2015. The current usage metrics is available 48-96 hours after online publication and is updated daily on week days.
Initial download of the metrics may take a while.