Fig. 8
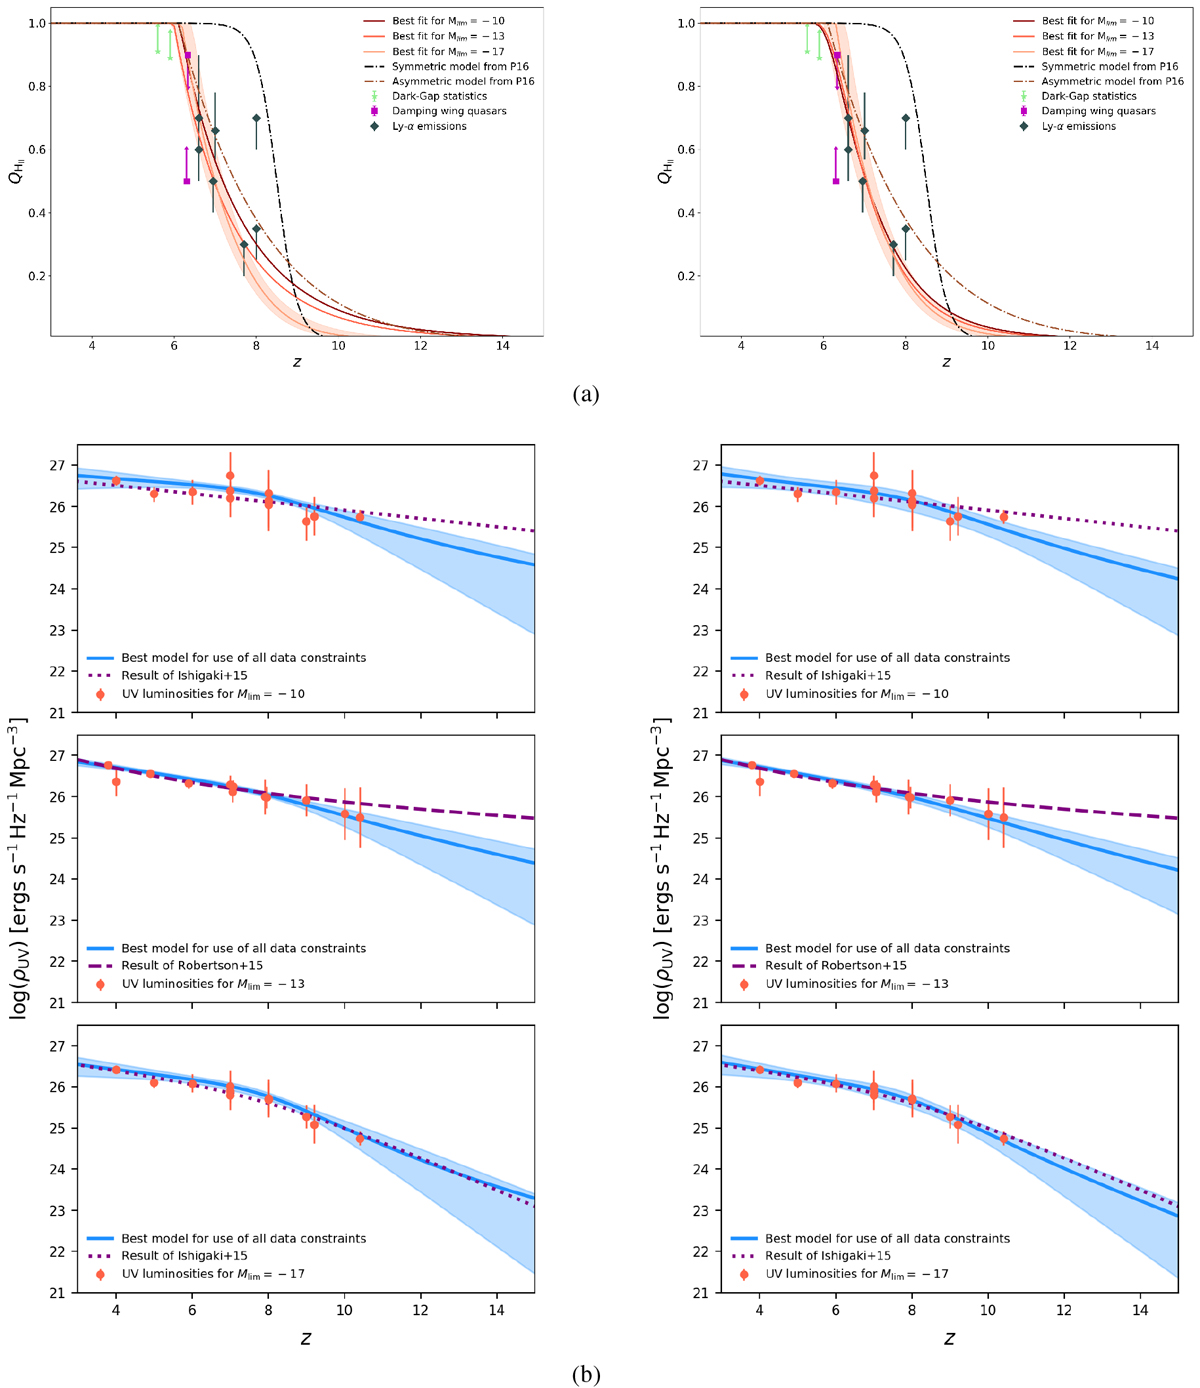
Panels a: redshift evolution of QH II for various choices of the magnitude limit in luminosity data: brown for Mlim = −10, orange for Mlim = −13 and beige forMlim = −17. The light orange region represents the 68% confidence level for the worst case scenario, i.e. Mlim = −17. Left panel: escape fraction fixed to the values used by corresponding references. Right panel: escape fraction varying between zero and one. Panels b: UV luminosity density ρUV with redshift in logarithmic scale for three values of the magnitude limit: Mlim =−10 in the upper panel, Mlim = −13 in the middle panel and Mlim = −17 in the lower panel. Data points are from Ishigaki et al. (2015) or adapted from Robertson et al. (2015). Maximum likelihood parametrisations corresponding to Eq. (3) (continuous lines) are shown for fits using all observational constraints. The 68% confidence interval is represented as the light blue region. These results are compared with a model forced to reproduce results fromcorresponding references, drawn as the purple lines. Left panel: escape fraction fixed. Right panel: escape fraction allowed to vary between zero and one.
Current usage metrics show cumulative count of Article Views (full-text article views including HTML views, PDF and ePub downloads, according to the available data) and Abstracts Views on Vision4Press platform.
Data correspond to usage on the plateform after 2015. The current usage metrics is available 48-96 hours after online publication and is updated daily on week days.
Initial download of the metrics may take a while.