Fig. 4
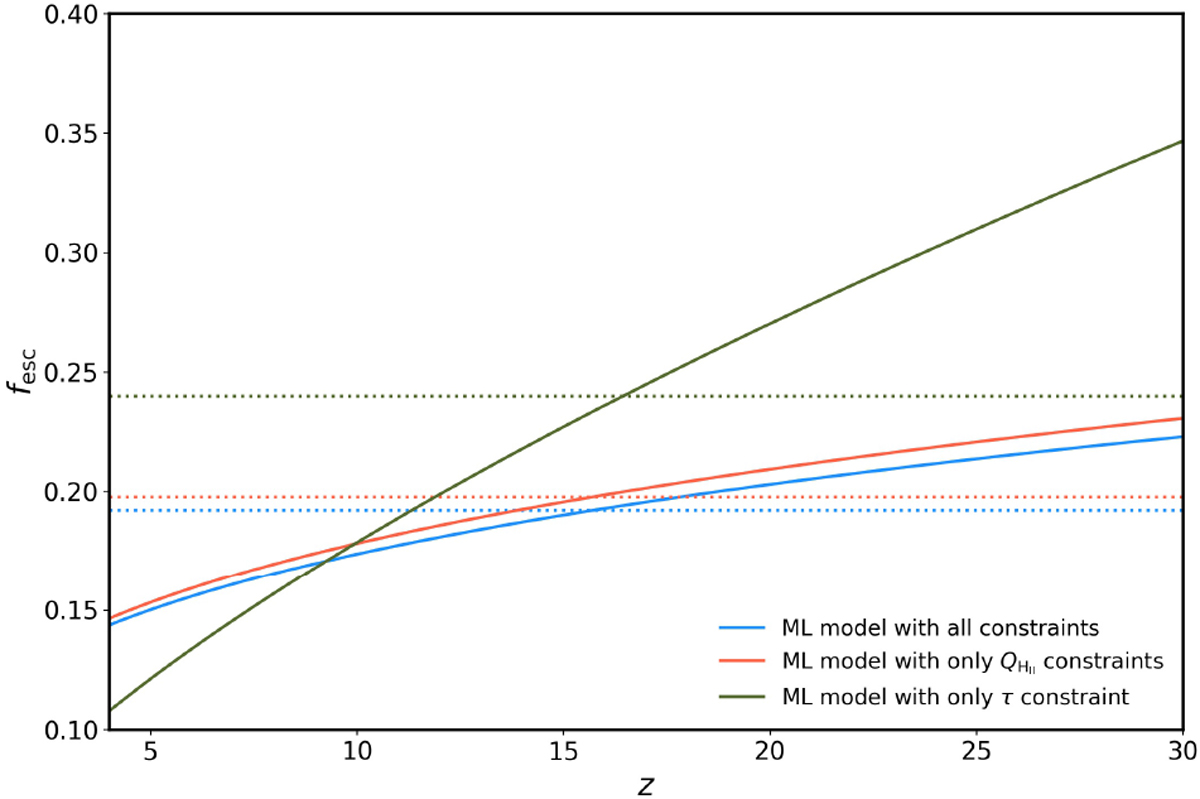
Possible evolutions of fesc with redshift. ML models are shown for various set of constraints: blue when all constraints are used; coral when τ constraints are skipped; green when QH II constraints are skipped. Horizontal dotted lines represent the mean value of fesc over 4 ≤ z ≤ 30 for the model of the corresponding colour.
Current usage metrics show cumulative count of Article Views (full-text article views including HTML views, PDF and ePub downloads, according to the available data) and Abstracts Views on Vision4Press platform.
Data correspond to usage on the plateform after 2015. The current usage metrics is available 48-96 hours after online publication and is updated daily on week days.
Initial download of the metrics may take a while.