Fig. 2
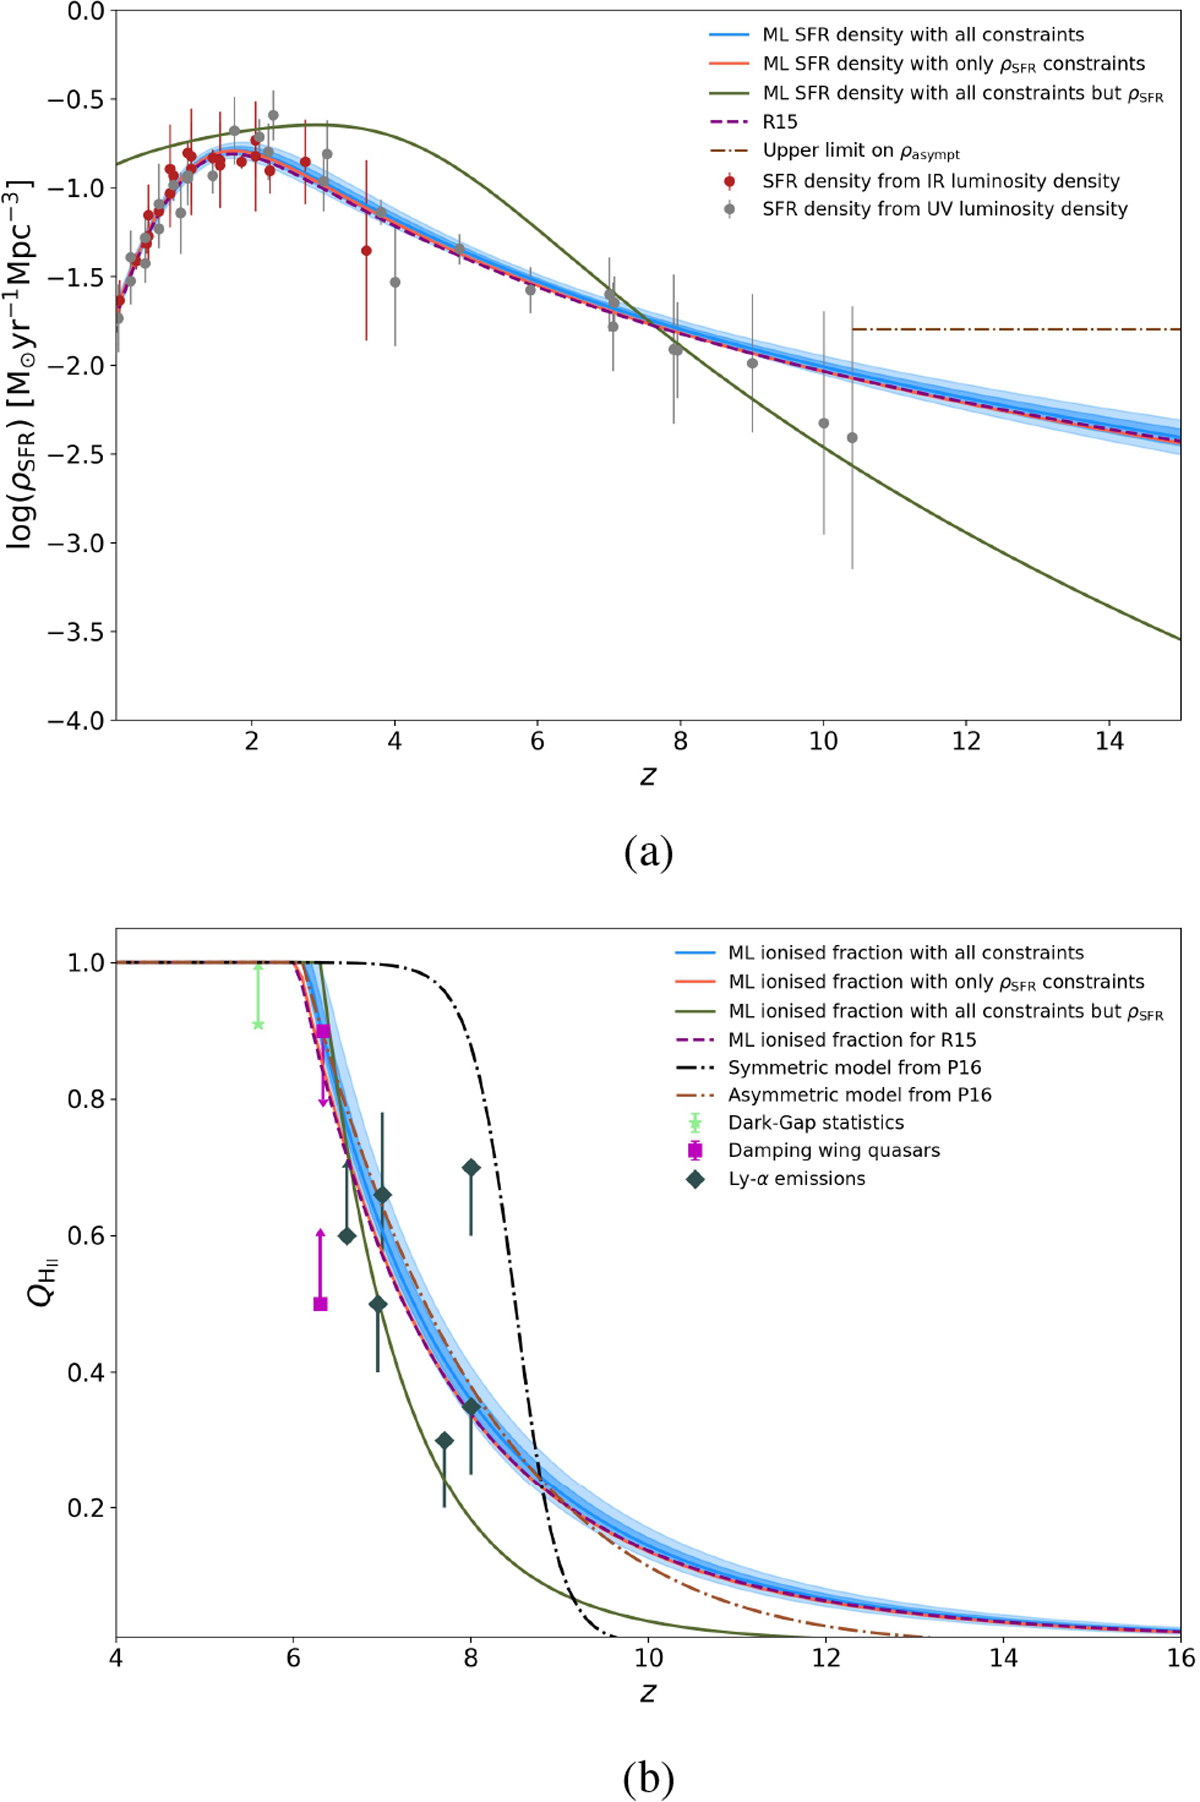
Panel a: star formation rate density ρSFR with redshift. Data points are determined from infrared (plotted in red) or ultraviolet (in grey) luminosity densities (Sect. 3). Maximum likelihood parametrisations (continuous lines) are shown for various set of constraints: blue when all constraints are used; coral when only data on star formation are used; green when τ and reionisation history data are used. The 68% confidence interval on ρSFR (light blue region) is drawn for the blue model. We note that the interval, corresponding to statistical uncertainties, is very narrow. These inferences are compared with a model forced to reproduce results from Robertson et al. (2015), cited as R15 in the legend, drawn as the purple dotted line. The horizontal dashed-dotted line corresponds to the upper limit on a hypothetical constant value of ρSFR for z > 10.4 (Sect. 5.2). Panel b: ionised fraction of the IGM QH II with redshiftfor same models as (a). Details on the origin of data points are given in the legend and Sect. 3. Inferences are also compared with the two evolutions used in Planck Collaboration Int. XLVII (2016, cited as P16) to model the reionisation process: a redshift-symmetric hyperbolic tangent as the brown dashed-dotted line and a redshift-asymmetric power-law in black.
Current usage metrics show cumulative count of Article Views (full-text article views including HTML views, PDF and ePub downloads, according to the available data) and Abstracts Views on Vision4Press platform.
Data correspond to usage on the plateform after 2015. The current usage metrics is available 48-96 hours after online publication and is updated daily on week days.
Initial download of the metrics may take a while.