Fig. 4.
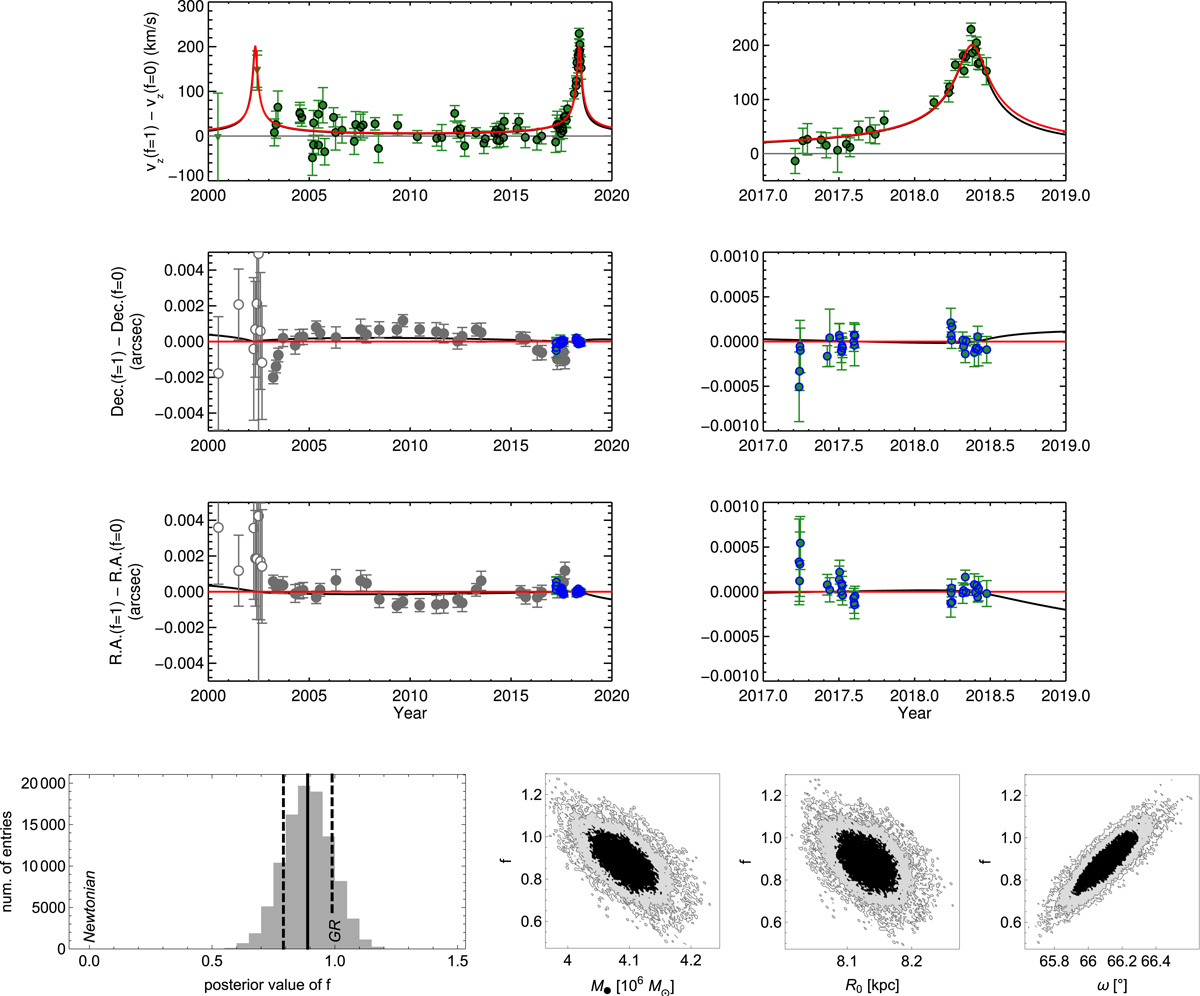
Posterior analysis of all data by fitting for f simultaneously with all other parameters. We plot the residuals in spectroscopy (top, NIRC2, NACO, and SINFONI), Dec and RA (middle two panels, filled grey: NACO; open grey: SHARP; green filled blue: GRAVITY) between the best f = 1 fit and the f = 0 (Newtonian) part of that fit for the model (red line) and all data. The black curve includes the Schwarzschild precession. Here, we down-sampled the NACO data into 100 equal bins along the orbit to obtain a constant weighting in spatial coverage. With a weight of 0.5 for the NACO data (in order to account for the systematic errors), this yields a 10 σ result in favour of GR (f = 0.90 ± 0.09), and ![]() . The bottom panel shows the posterior probability distributions for f and its correlation with the mass M• and distance R0 of the massive black hole, and the argument of periapsis ω. The distributions are compact and all parameters are well determined.
. The bottom panel shows the posterior probability distributions for f and its correlation with the mass M• and distance R0 of the massive black hole, and the argument of periapsis ω. The distributions are compact and all parameters are well determined.
Current usage metrics show cumulative count of Article Views (full-text article views including HTML views, PDF and ePub downloads, according to the available data) and Abstracts Views on Vision4Press platform.
Data correspond to usage on the plateform after 2015. The current usage metrics is available 48-96 hours after online publication and is updated daily on week days.
Initial download of the metrics may take a while.