Fig. 2.
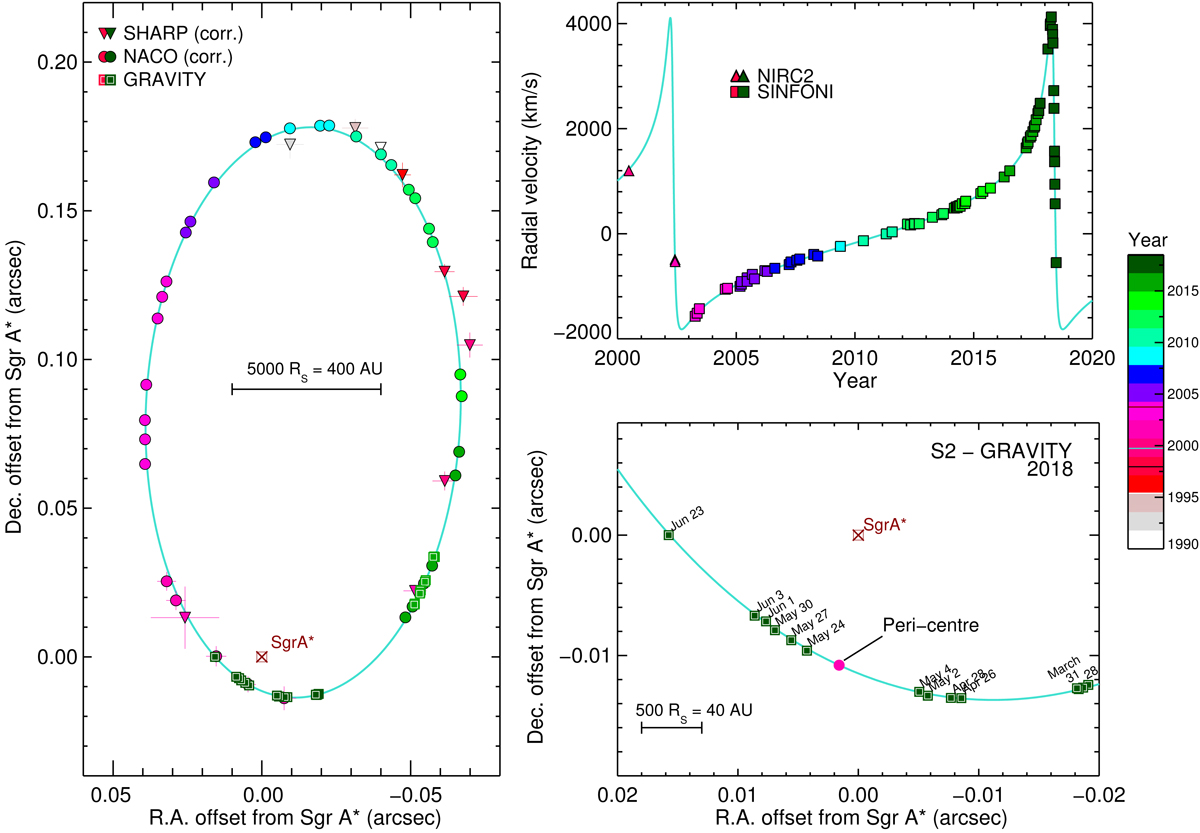
Summary of the observational results of monitoring the S2 – Sgr A✻ orbit from 1992 to 2018. Left: projected orbit of the star S2 on the sky (J2000) relative to the position of the compact radio source Sgr A✻ (brown crossed square at the origin). Triangles and circles (and 1σ uncertainties) denote the position measurements with SHARP at the NTT and NACO at the VLT, colour-coded for time (colour bar on the right side). All data points are corrected for the best-fit zero-point (x0; y0) and drifts (ẋ0, ẏ0) of the coordinate system relative to Sgr A✻ (see Plewa et al. 2015). Green squares mark the GRAVITY measurements. The bottom right panel shows a zoom around pericentre in 2018. Top right: radial velocity of S2 as a function of time (squares: SINFONI/NACO at the VLT; triangles: NIRC2 at Keck). S2 reached pericentre of its orbit at the end of April 2002, and then again on May 19th, 2018 (MJD 58257.67). The data before 2017 are taken from Ghez et al. (2008), Boehle et al. (2016), Chu et al. (2018), and Gillessen et al. (2017, 2009b). The 2017/2018 NACO/SINFONI and GRAVITY data are presented here for the first time. The cyan curve shows the best-fitting S2 orbit to all these data, including the effects of General and Special Relativity.
Current usage metrics show cumulative count of Article Views (full-text article views including HTML views, PDF and ePub downloads, according to the available data) and Abstracts Views on Vision4Press platform.
Data correspond to usage on the plateform after 2015. The current usage metrics is available 48-96 hours after online publication and is updated daily on week days.
Initial download of the metrics may take a while.