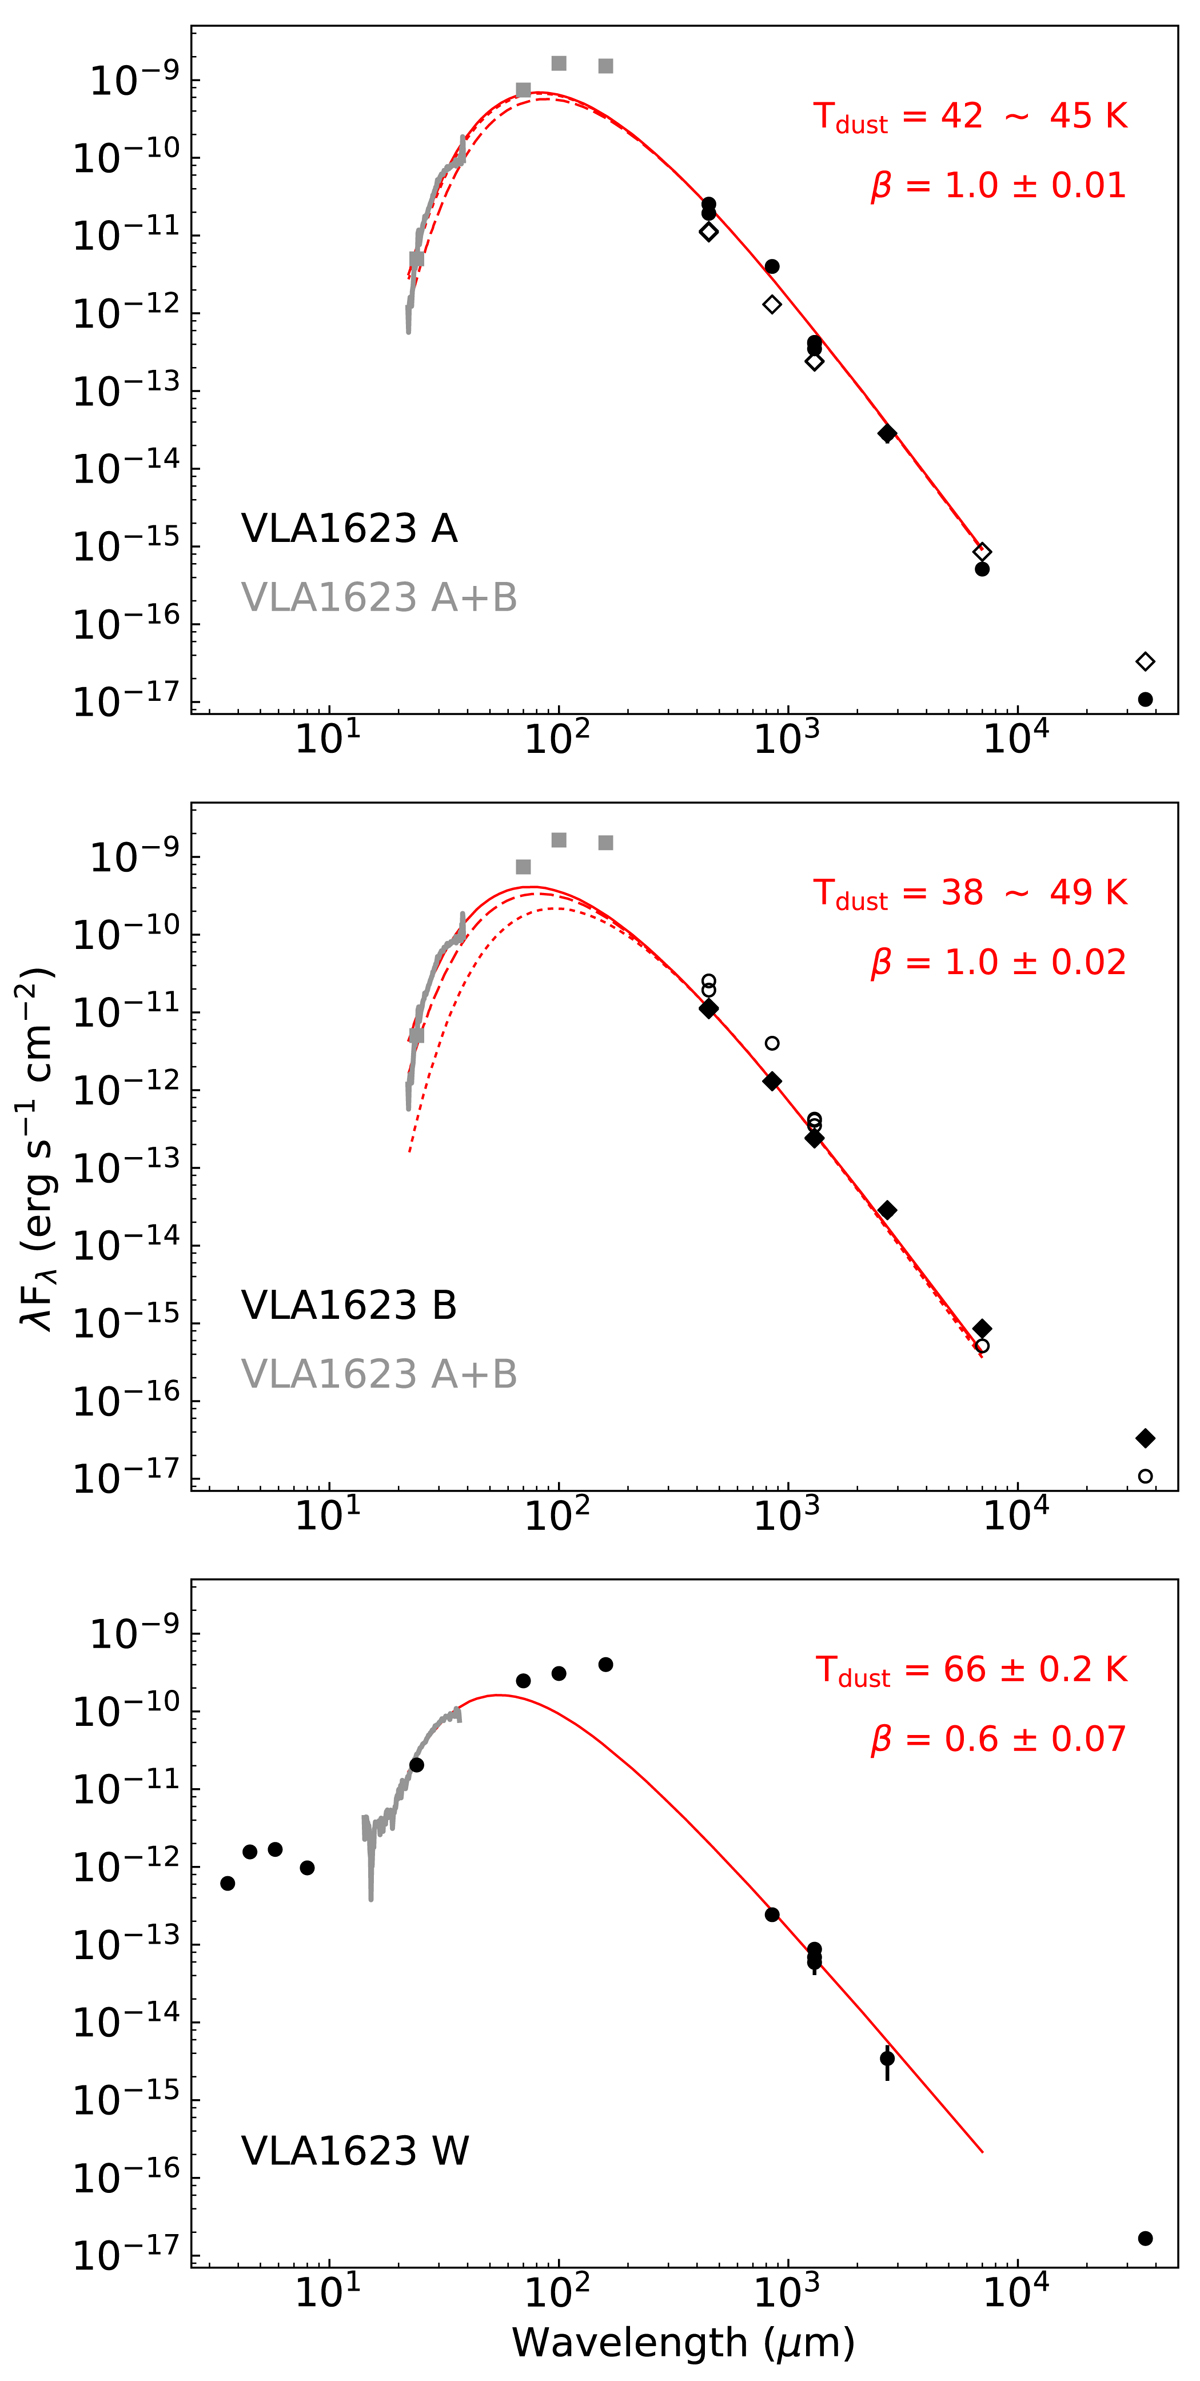
Fig. 2.

Spectral energy distribution of VLA 1623 including the Spitzer IRS spectra. The red curves show the best fit graybody to each SED. The dust temperature Tdust and dust emissivity index ² are indicated in each panel. For VLA 1623 A (top) and B (middle), the dashed curves show the best fit assuming that the emission at λ < 450 µm is evenly distributed among the two sources. The dotted curve assumes VLA 1623 B only contributes one-tenth of the total emission for λ < 450 µm. The open symbols in the top and middle panel are the fluxes for VLA 1623 B and VLA 1623 A, respectively, and are included for ease of comparison.
Current usage metrics show cumulative count of Article Views (full-text article views including HTML views, PDF and ePub downloads, according to the available data) and Abstracts Views on Vision4Press platform.
Data correspond to usage on the plateform after 2015. The current usage metrics is available 48-96 hours after online publication and is updated daily on week days.
Initial download of the metrics may take a while.


