Fig. 8
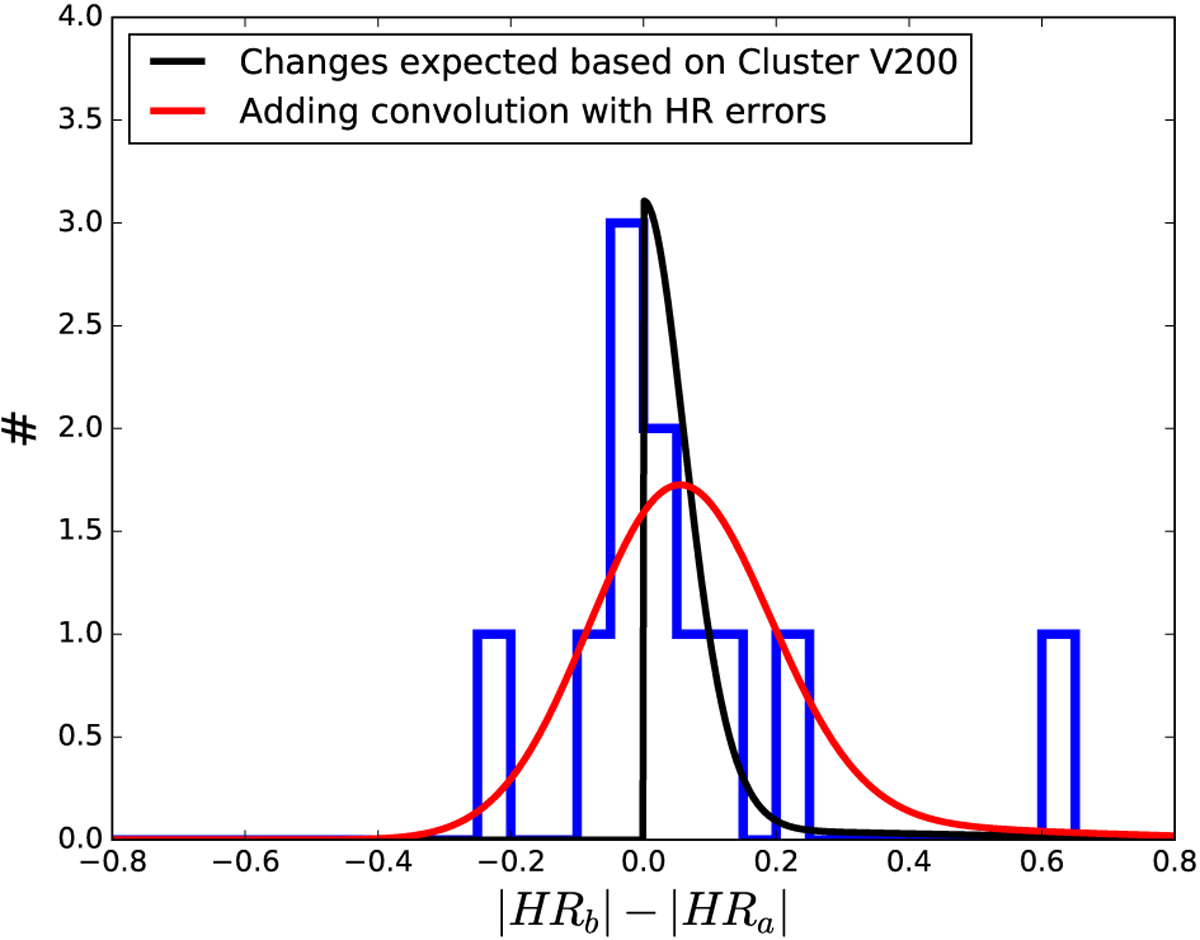
Distribution of the difference in absolute HR after (HRa) and before (HRb) peculiar velocity correction (in blue). The black line represents the expected distribution of the difference in HR, and the red curve is the expected change convolved with error distribution. The results are compatible with the observed distribution given the Poisson uncertainties of each histogram bin.
Current usage metrics show cumulative count of Article Views (full-text article views including HTML views, PDF and ePub downloads, according to the available data) and Abstracts Views on Vision4Press platform.
Data correspond to usage on the plateform after 2015. The current usage metrics is available 48-96 hours after online publication and is updated daily on week days.
Initial download of the metrics may take a while.