Fig. 6
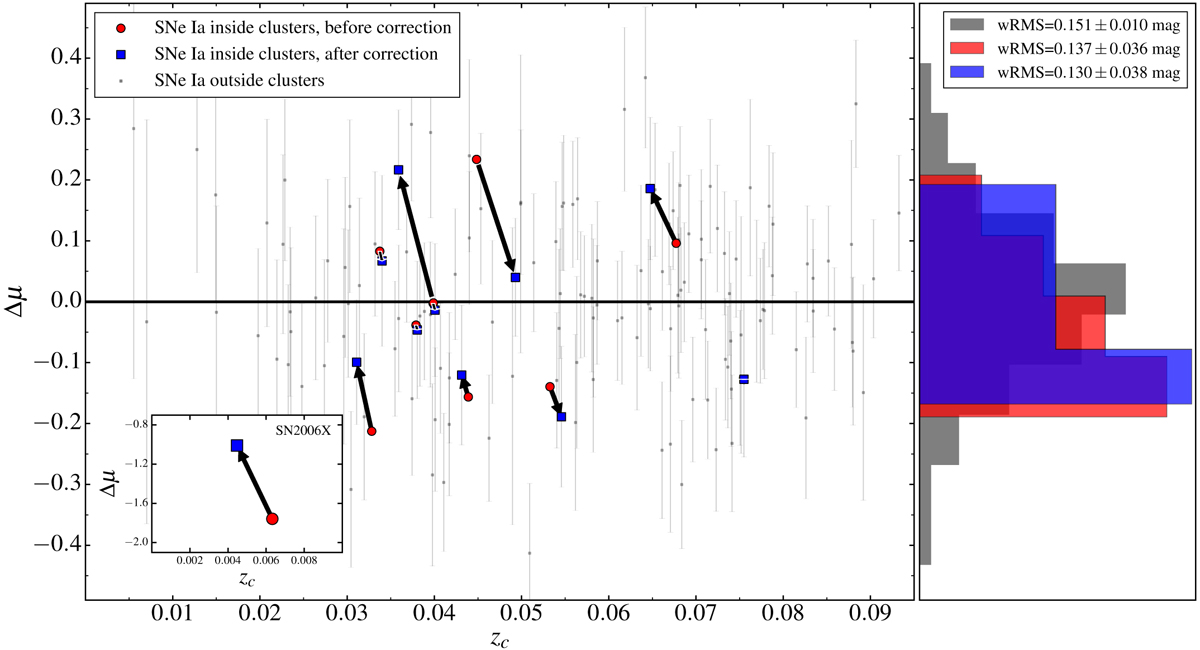
Hubble diagram residuals. For cluster members red circles (blue squares) and histograms correspond to residuals for SNe Ia in galaxy clusters before (after) correction for peculiar velocities of the hosts inside their clusters. The black histogram corresponds to all SNe Ia after correction. SN2006X is presented in the inset plot separately from the others owing to its very large offset.
Current usage metrics show cumulative count of Article Views (full-text article views including HTML views, PDF and ePub downloads, according to the available data) and Abstracts Views on Vision4Press platform.
Data correspond to usage on the plateform after 2015. The current usage metrics is available 48-96 hours after online publication and is updated daily on week days.
Initial download of the metrics may take a while.