Fig. 5
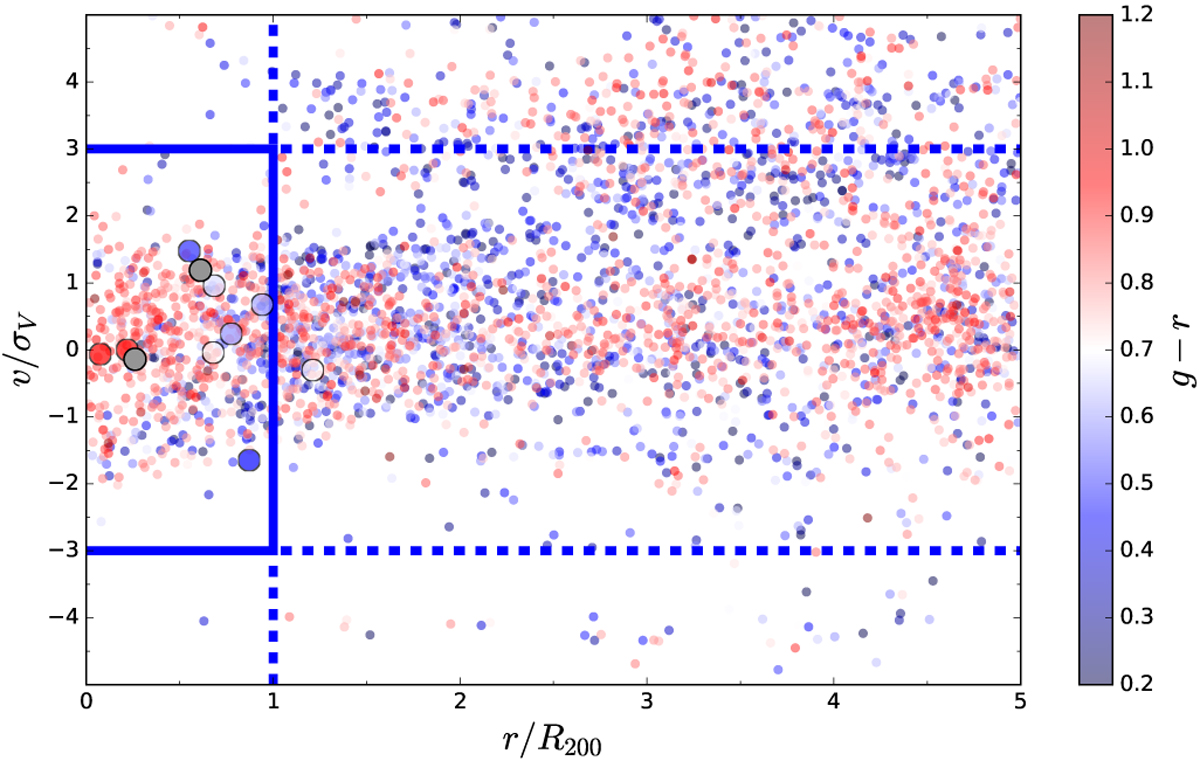
Speed normalized by velocity dispersion within the ensemble cluster vs. the distance between galaxies and ensemble cluster normalized by R200. The small points indicate galaxies with spectroscopy from SDSS. The big points represent the positions of host galaxies of our SNe Ia. The color bar shows the corresponding g− r color; the points filled with gray do not have color measurements. The solid lines show the cuts we applied to associate SNe Ia withclusters, and the dashed lines represent the prolongation of those cuts.
Current usage metrics show cumulative count of Article Views (full-text article views including HTML views, PDF and ePub downloads, according to the available data) and Abstracts Views on Vision4Press platform.
Data correspond to usage on the plateform after 2015. The current usage metrics is available 48-96 hours after online publication and is updated daily on week days.
Initial download of the metrics may take a while.