Fig. 3
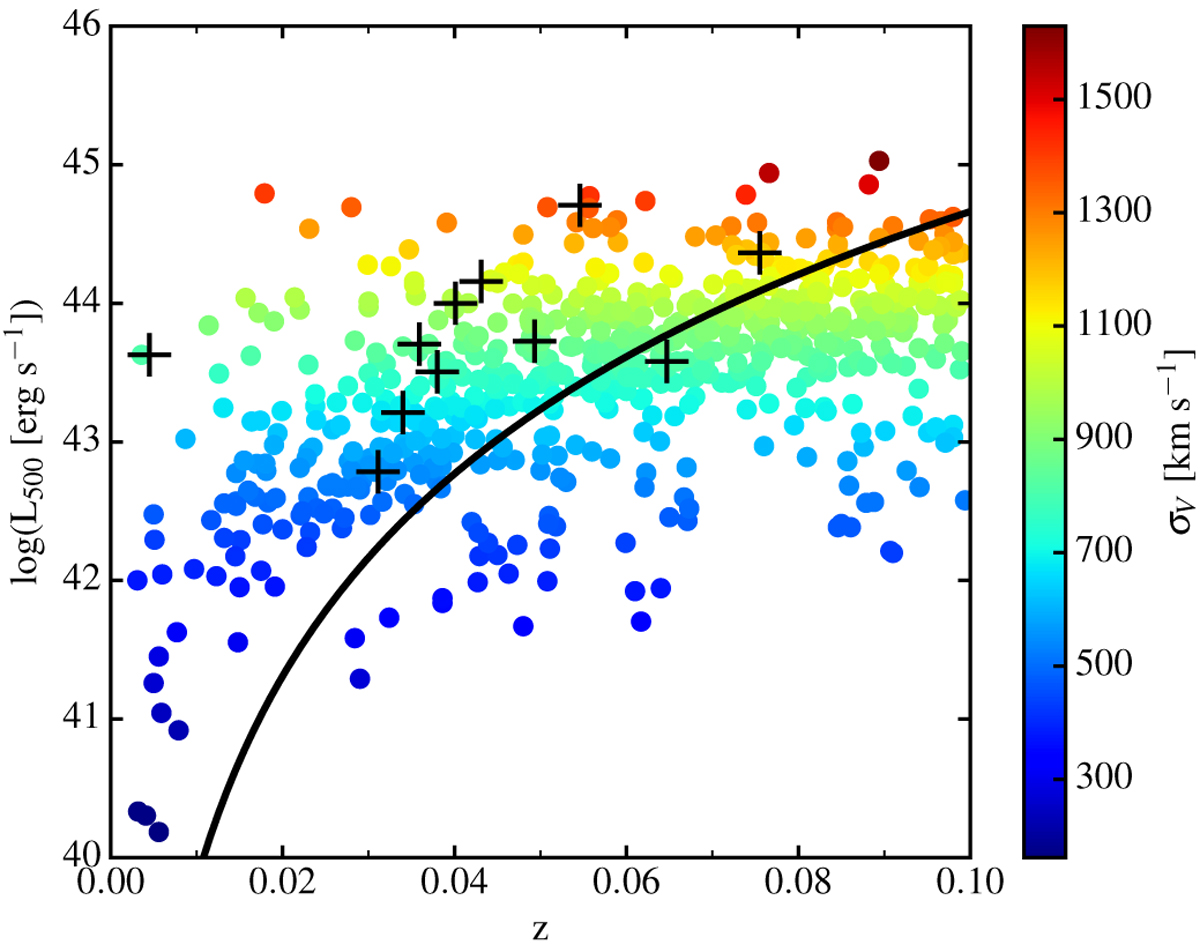
Luminosities of [0.1–2.4 keV] within R500 of MCXC clusters (Piffaretti et al. 2011) as a function of redshift, up to z = 0.1. The colorbarshows the corresponding cluster velocity dispersion σV calculated from Eq. (7). Black plus signs indicate clusters from the current analysis. The black curve corresponds to the intrinsic dispersion of SNe Ia on the Hubble diagram found for the JLA sample (Betoule et al. 2014) projected onto cluster luminosities by combining the luminosity–mass and mass–velocity dispersion relations.
Current usage metrics show cumulative count of Article Views (full-text article views including HTML views, PDF and ePub downloads, according to the available data) and Abstracts Views on Vision4Press platform.
Data correspond to usage on the plateform after 2015. The current usage metrics is available 48-96 hours after online publication and is updated daily on week days.
Initial download of the metrics may take a while.